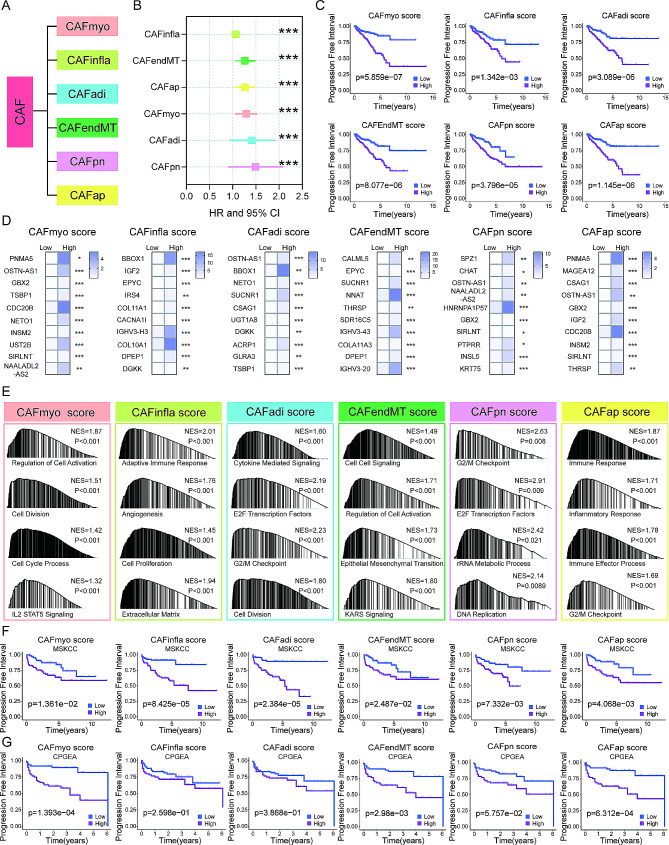
Fig. 2.
The CAF subtype classification and scores for progression prediction in PCa. (A) The classification of CAF subtypes. (B) Univariate Cox regression analysis of CAF subtype scores and association with progression-free interval (PFI). (C) Kaplan-Meier analysis of the CAF subtype scores and association with PFI. (D) Heatmap of top 10 differentially expressed genes in CAF subtype score low and high groups. (E) GSEA results showing the activated signaling pathways in the CAF score high group. (F-G) The validation of the CAF subtype score model to predict PFI, as determined by Kaplan-Meier analysis in MSKCC and CPGEA PCa cohorts

