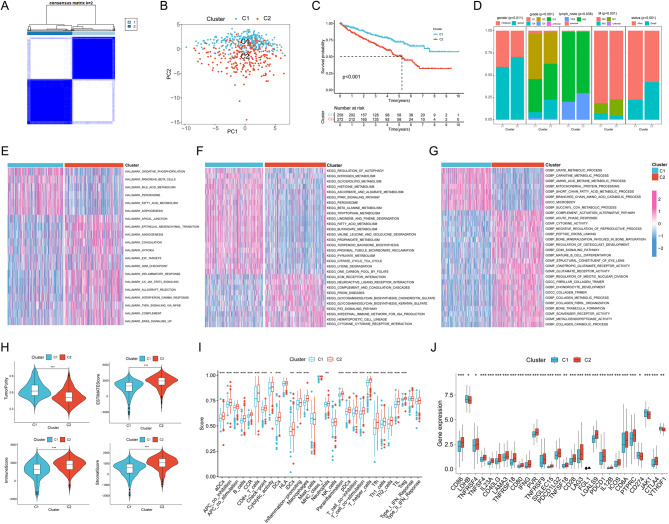
Fig. 1.
Identification of vasculogenic mimicry-related isoforms. (A) Clustering heat map of ccRCC divided into two clusters. PCA analysis (B), survival curves (C) and clinical shapes (D) were analyzed between the two clusters. Heatmaps of enrichment in HALLMARK pathway (E), KEGG (F) and GO (G) pathway enrichment between the two clusters were identified by enrichment analysis. (H) Tumor purity, ESITIMATE score, immune score and stroma score between the two clusters. (I) Comparison of differences in immune function and immune cell infiltration levels between the two clusters by ssGSEA. (J) Analysis of common immune checkpoint differences between the two clusters. Note * p < 0.05, **p < 0.01, ***p < 0.001

