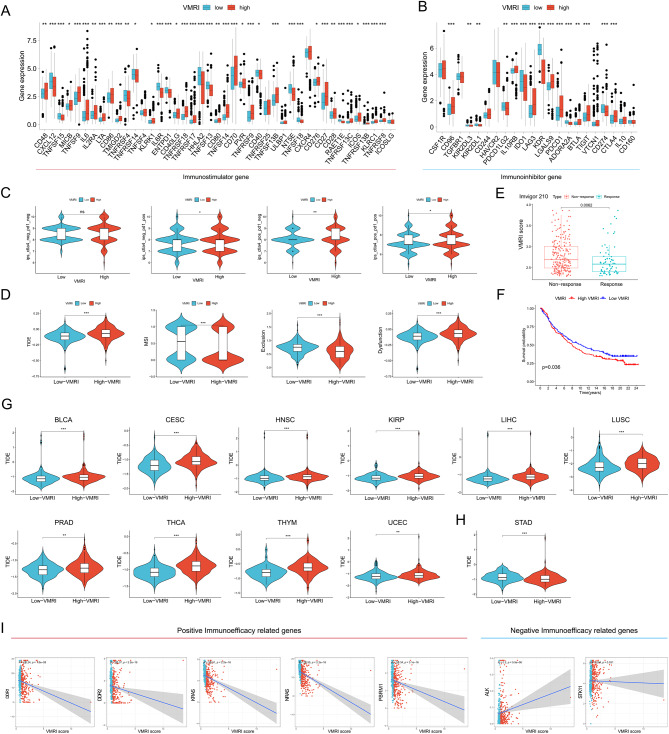
Fig. 5.
Low VMRI is associated with better immunotherapy response. Differences in immunostimulatory genes (A) and immunosuppressive genes (B) between high and low VMRI groups. (C) IPS scores of anti-PD1(-)CTLA4(-), anti-PD1(+)CTLA4(-), anti-PD1(-)CTLA4(+), and anti-PD1(+)CTLA4(+) blockers in the high and low VMRI groups. (D) Differences in TIDE, MSI, Exclusion, and Dysfunction between high and low VMRI groups. (E) Differences in VMRI scores between immunotherapy-responsive and non-responsive groups in the Imvigor210 cohort. (F) Survival curves for high/low VMRI groups in the Imvigor210 cohort. (G-H) VMRI score for immunotherapy efficacy in pan-cancer. (I) Association of VMRI with genes related to immunotherapy efficacy. Note * p < 0.05, **p < 0.01, ***p < 0.001

