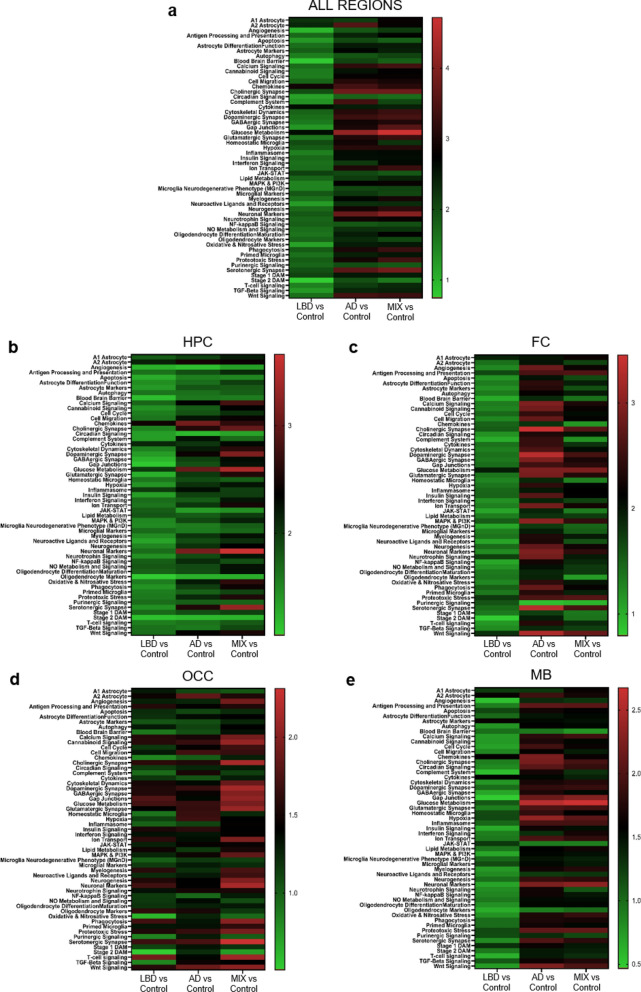
Fig. 5.
Whole tissue transcriptomic analysis across brain regions with nCounter platform. Differences in immune response patterns between AD, MIX, LBD and Control cases depend on the anatomical brain region. a – e Heatmap of signaling pathway scores derived from the nCounter Glial Subtype Profiling Panel for AD, MIX, LBD and Control cases independent of the brain region (a) and in the hippocampus (b), frontal cortex (c) occipital cortex (d) and midbrain (e). Pathway scores are depicted in alphabetical order. Green to red indicates upregulation of signaling pathway compared to Control

