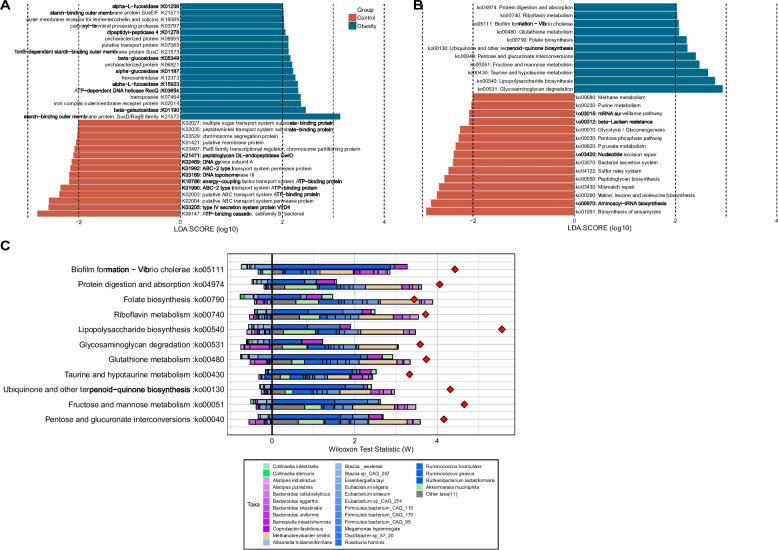
Fig. 3.
The microbiota functional characterization in obesity. Differential enrichment analysis of the KOs (A) and KEGG pathways (B) between the obesity and control groups. KOs or KEGG pathways with LDA > 2.0 and p < 0.05 are shown. Blue and red color represent obesity- and control- enriched KOs or pathways, respectively. (C) Taxon-level contribution profiles of the functional shift in the obesity. The x-axis depicts the ranking and statistical scores, while the y-axis represents the associated pathways. Taxa attenuating each functional shift are presented on the left side of the vertical line, whereas those driving each functional shift are depicted on the right side of the vertical line. For each KEGG pathway, the top bars represent contributions from obesity-associated taxa and the lower bars represents contributions from obesity-depleted taxa. Red diamonds represent taxa-based functional shift scores

