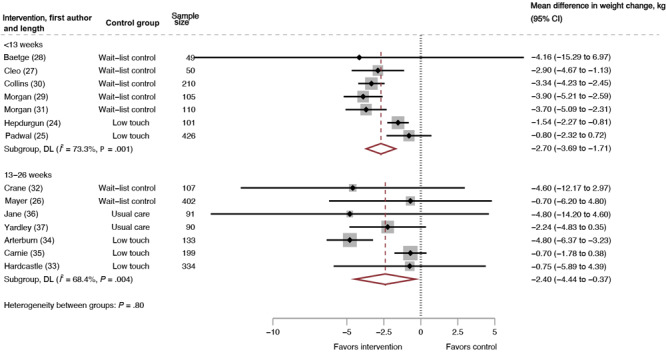
Figure 3.
Mean difference in weight change by intervention duration, intervention versus control, systematic review of weight loss in short-term interventions (N = 14) for physical activity and nutrition among adults with overweight or obesity. Meta-analysis was of the effects of the intervention versus control on mean difference in weight change (kg), stratified by intervention duration. Intervention duration is defined as less than 13 weeks or 13 to 26 weeks. Values less than 0 indicate an intervention effect (ie, favors intervention), and values greater than 0 indicate no intervention effect (ie, favors control). Abbreviation: DL, DerSimonian and Laird’s Q test (22). Overall, DL (I 2 = 69.4%, P >.001).
| First author (reference) | Intervention length, weeks | Control | Sample size | Mean difference in weight change, kg (95% CI) |
|---|---|---|---|---|
| Baetge (28) | <13 | Wait-list control | 49 | –4.16 (–15.29 to 6.97) |
| Cleo (27) | <13 | Wait-list control | 50 | –2.90 (–4.67 to –1.13) |
| Collins (30) | <13 | Wait-list control | 210 | –3.34 (–4.23 to –2.45) |
| Morgan (29) | <13 | Wait-list control | 105 | –3.90 (–5.21 to –2.59) |
| Morgan (31) | <13 | Wait-list control | 110 | –3.70 (–5.09 to –2.31) |
| Hepdurgun (24) | <13 | Low touch | 101 | –1.54 (–2.27 to –0.81) |
| Padwal (25) | <13 | Low touch | 426 | –0.80 (–2.32 to 0.72) |
| Crane (32) | 13–26 | Wait-list control | 107 | –4.60 (–12.17 to 2.97) |
| Mayer (26) | 13–26 | Wait-list control | 402 | –0.70 (–6.20 to 4.80) |
| Jane (36) | 13–26 | Usual care | 91 | –4.80 (–14.20 to 4.60) |
| Yardley (37) | 13–26 | Usual care | 90 | –2.24 (–4.83 to 0.35) |
| Arterburn (34) | 13–26 | Low touch | 133 | –4.80 (–6.37 to –3.23) |
| Carnie (35) | 13–26 | Low touch | 199 | –0.70 (–1.78 to 0.38) |
| Hardcastle (33) | 13–26 | Low touch | 334 | –0.75 (–5.89 to 4.39) |

