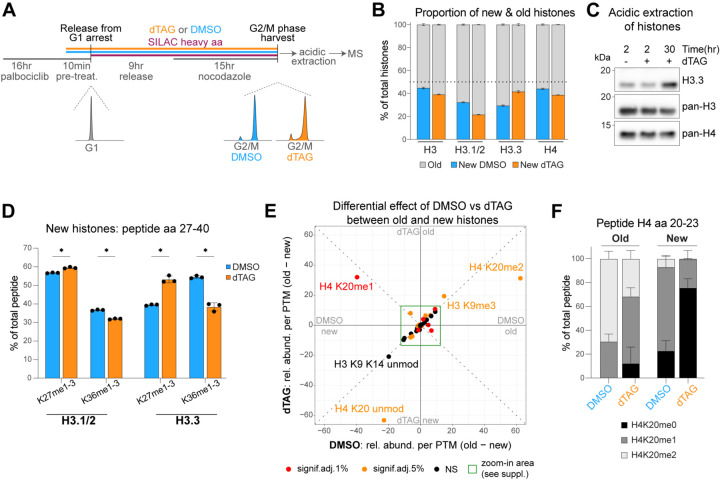
Figure 4. CAF-1 loss leads to histone imbalance and globally affects chromatin maturation within a single S-phase.
A) SILAC-MS set up for analysis of old and new histones, their PTMs and variants of cells that underwent exactly one full S-phase after the start of DMSO/dTAG treatment. DAPI FACS profiles of the different conditions are shown.
B) Cumulative barplots of the proportion of old and new histones in DMSO and dTAG. The horizontal dotted line is set at 50%.
C) Western blot of acidic extractions of degron-CHAF1A cells (clone 8) treated with DMSO or dTAG for indicated times.
D) Quantification of new H3.1/2 and H3.3 peptides (amino acids 27–40). The height of the barplots represent the relative abundances of mono-, di- and tri-methylation of K27 or K36 that were summed up.
E) Scatterplot of the differential effect of DMSO (x-axis) vs dTAG (y-axis) between old and new histones. Colors encode significance levels (p-value) after Benjamini-Hochberg adjustment. A zoom-in is available in Supplemental Figure S4D.
F) Quantification of the H4K20-anchored PTMs relative abundance on old and new H4 peptide 20–23 associated with DMSO or dTAG treatment.
(B,D,F) Quantification of histones and their PTMs of degron-CHAF1A cells (clone 8) treated as described in (A). Percentages are relative to the total intensity of related peptides and averaged across n = 3 biological replicates. Error bars represent SD, asterisks represent p-values as * < 0.05, ** < 0.01, *** < 0.001, **** < 0.0001 as result of unpaired, parametric ttests.

