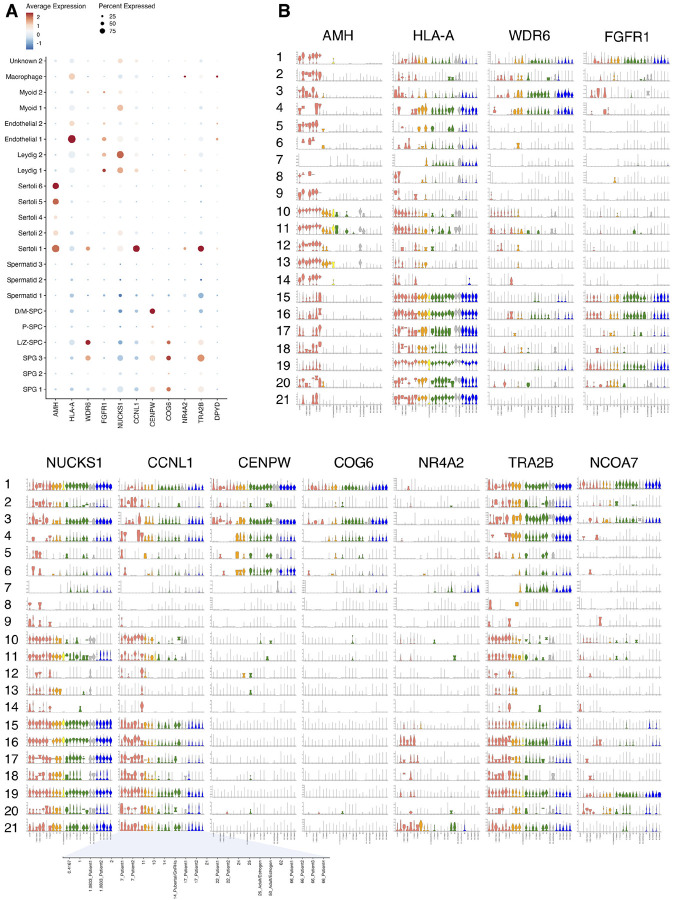
Figure 5: Impact of puberty blocker and aging on expression of puberty-associated genes (PAGs).
A) Dot plot depicting relative expression of select PAGs across all cell types. B) Violin plots representing the expression patterns of select PAGs across cell types and age. Cell types are denoted by numbers viz., 1=SPG 1; 2=SPG 2; 3=SPG 3; 4=L/Z-SPC; 5=P-SPC; 6=D/M-SPC; 7=Spermatid 1; 8=Spermatid 2; 9=Spermatid 3; 10=Sertoli 1; 11=Sertoli 2; 12=Sertoli 4; 13=Sertoli 5; 14=Sertoli 6; 15=Leydig 1; 16=Leydig 2; 17=Myoid 1; 18=Myoid 2; 19=Endothelial 1; 20=Endothelial 2; and 21=Macrophage.

