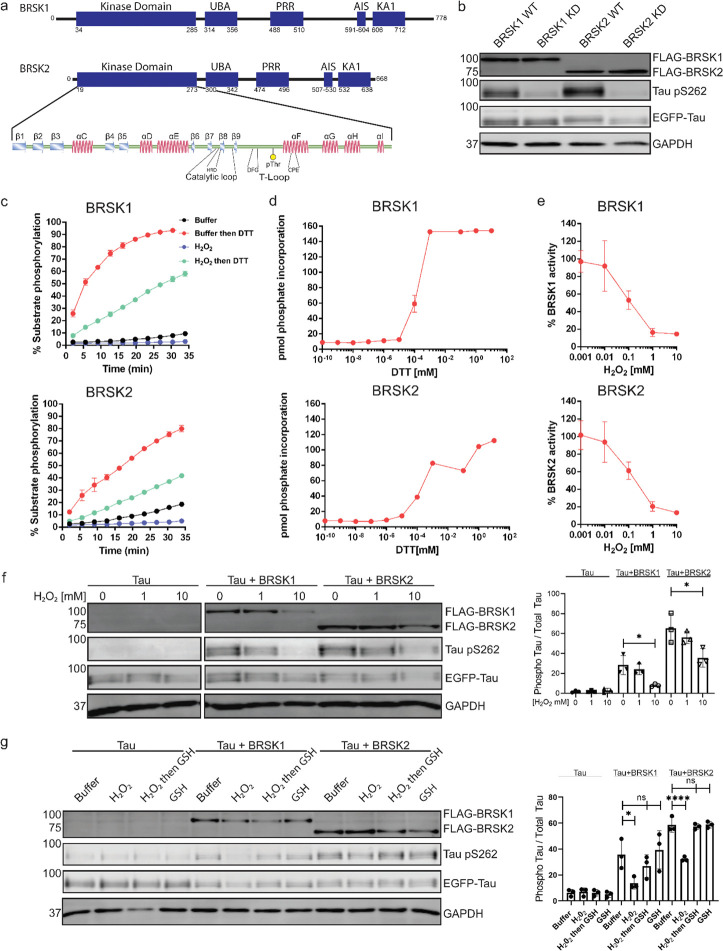
Figure 1:
BRSK1/2 are redox sensitive. (a) Schematic representation of BRSK domain architecture, including Kinase domain, Ubiquitin Associated (UBA) domain, Proline-Rich Region (PRR), Kinase Associated Domain(KA1), and Autoinhibitory Sequence (AIS). (b) Immunoblotting showing BRSK dependent phosphorylation of Tau at Ser262 (pS262), from lysates of HEK-293T cells overexpressing full-length FLAG-BRSK1 or 2 (wild type [WT] or kinase dead [KD]) and EGFP-Tau. (c) Real time phosphorylation of fluorescent AMARA peptide by full length BRSK1 and 2 (200 ng) purified from Sf21 cells. BRSK proteins were incubated with buffer or 1 mM H2O2 for 10 mins, reactions were then initiated with the addition of ATP and peptide substrate in the presence (where indicated) of 10 mM DTT. Dose response curves for (d) DTT and (e) H2O2 with 200 ng full-length BRSK1 and BRSK2. All kinases assays are shown as mean and SD of three experiments. (f) Immunoblott (left) of pS262 in transiently co-transfected HEK-293T cells incubated with the indicated concentration of H2O2 for 10 mins. Signal density for phospho Tau S262 and total Tau (GFP) was obtained using ImageStudio software (Licor) and results from at least 3 biological replicates were anaylzed with Graphpad Prism software using one way anova to determine significance. Data shown is mean and SE. (g) Representative immunoblot (left) of transiently co-transfected HEK-293T cells treated with 10 mM H2O2 for 10 mins before the addition of 20 mM GSH. Whole cell lysates were harvested after a further 15 mins. Normalized densitometry of Tau pS262 signal (right) was calculated from 3 independent experiments. Data shown is mean and SD. * = P < 0.05, **= P < 0.01, ***= P < 0.001.

