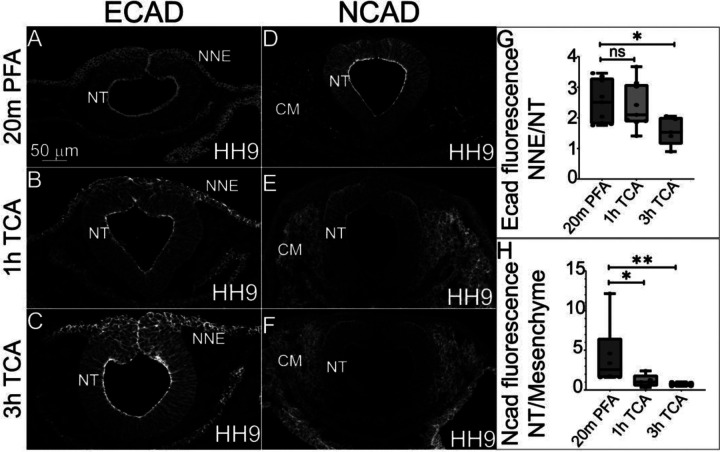
Figure 4. TCA and PFA fixation result in tissue-specific differences in fluorescence intensity of cadherin proteins.
(A-F) Transverse sections comparing three fixative conditions prior to IHC for ECAD and NCAD in chicken embryos at stage HH9. (A-C) IHC for ECAD of embryos fixed in (A) 2% PFA, (B) 1 hr TCA, and (C) 3 hr TCA shows increased overall signal intensity after TCA fixation. (D-F) IHC for NCAD of embryos fixed in fixed in (D) 2% PFA, (E) 1 hr TCA, and (F) 3 hr TCA shows increased cranial mesenchyme and reduced neural tube signal intensity after TCA fixation. (G) The graph shows a significant decrease in the difference in intensity between the NNE and NT when comparing PFA to 3 hr TCA fixation (P ≤ 0.05, n= 6 TCA and n= 5 PFA). (H) The graph shows a significant decrease in the difference in fluorescence intensity in the NT compared to the cranial mesenchyme in embryos fixed for 1h in TCA (P ≤ 0.05, n=5) and 3h TCA (P ≤ 0.01, n=6) when compared to the PFA fixation. NT= neural tube, NNE= non-neural ectoderm, CM= cranial mesenchyme. One-way ANOVA with the Mann-Whitney test was used for analysis. The scale bar for transverse sections is 50μm.

