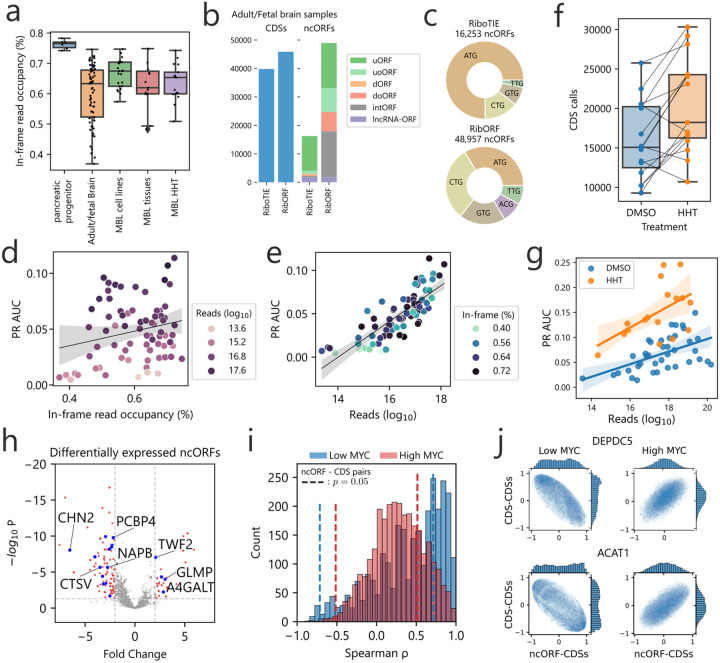
Figure 2: Application of RiboTIE to human normal tissues and brain cancer for improved analysis of RNA translation.
a, Box plot showing the in-frame read occupancy (reads mapped to reading-frame vs. total reads within CDSs) for all data applied in this study (MBL: medulloblastoma). b, Bar plot displaying the combined number of unique calls for annotated CDSs and ncORFs on 73 adult/fetal brain samples as reported by the original paper14 (RibORF) and RiboTIE. c, A pie chart on the start codon distribution of all called ncORFs. d, Scatter plot displaying the PR AUC performance of RiboTIE on adult/fetal brain samples as a function of mapped reads on the transcriptome and e, in-frame read occupancy. f, Number of CDSs called by RiboTIE outlined by both a scatter plot and box plot for medulloblastoma cell lines treated with DMSO control or homoharringtonine (HHT). Identical cell lines are linked. g, Scatter and fited linear regression plot on 30 DMSO (blue) and 15 HHT (orange) medulloblastoma samples. h, Volcano plot showing differential expression of called ncORFs of low MYC (n=8) as compared to high MYC (n=15) expressing medulloblastoma cell lines. Threshold lines denote p = 0.05 (y-axis) and |fold change| > 2 (x-axis). Blue dots accompanied by listed gene names are ncORFs confirmed by TIS Transformer. i, Histogram showing correlation existent between ncORFs and their matching CDSs for both low MYC (blue) and high MYC (red) cell lines. Threshold lines denote p = 0.05. j, Scatter plots of Spearman rank correlations between the ncORF or downstream CDS and all other CDSs on the genome for both low and high MYC expression (SNAPC5/ACAT1).

