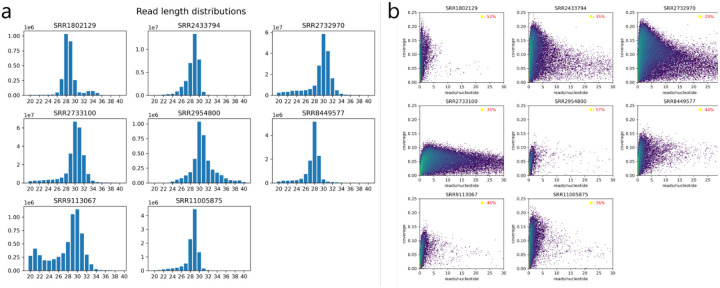
Extended Data Figure 1: Benchmark datasets characteristics.
a, Read length distributions for the benchmark datasets for reads mapped to the genome. The most abundant read length is generally around 29 nucleotides. b, 2D histogram of transcript-based coverage (y-axis) and reads mapped (x-axis). The number of mapped reads are normalized by transcript length (reads/nucleotide). The coverage is calculated based on the percentage of the transcript positions that have at least one read mapped by their 5’ position. The color map follows a logarithmic scale and is identical for all datasets. For each of the benchmark datasets, the percentage of transcripts in the transcriptome with no reads mapped is given (top-right corner).

