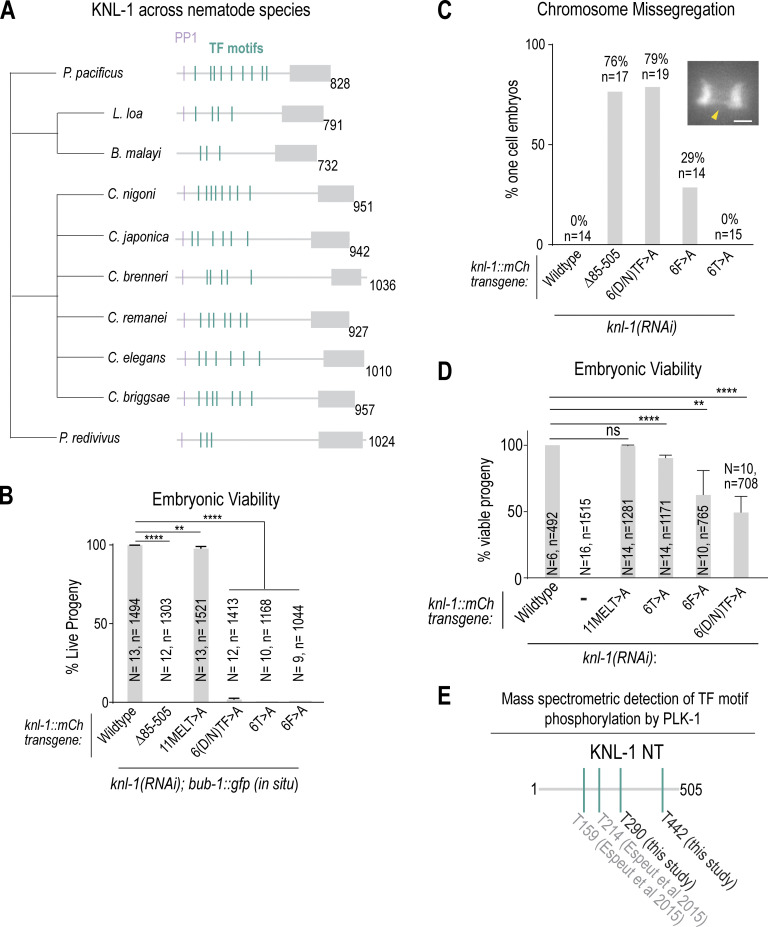
Figure S3.
Additional analysis of KNL-1 TF motifs. (A) Cladogram showing TF motifs present in knl-1 genes across different nematode species. (B) Embryonic viability was scored for indicated conditions; note that this analysis was conducted in the presence of in situ GFP-tagged BUB-1. N is the number of worms and n is the number of progeny scored. Error bars are the 95% confidence interval. (C and D) Chromosome missegregation and embryonic lethality analysis for the indicated KNL-1 variants when the endogenous bub-1 locus was untagged. (C) Chromosome missegregation was quantified for each of the indicated conditions. n is the number of embryos imaged. The inset image shows an example of missegregating chromosome, highlighted by a yellow arrowhead. Scale bar of inset, 2 μm. Example image is the same as shown in Fig. 1 B and Fig. 2 H. (D) Embryonic viability quantified for indicated conditions. N is the number of worms and n is the number of progeny scored. Error bars are the 95% confidence interval. (E) Schematic of TF motif phosphorylation by PLK-1 detected by mass spectrometry. Phosphorylation of T290 and T442 (TF motifs 4 and 6, respectively) was identified in this study. Phosphorylation of T159 and T214 (TF motif 2 and TF motif 3, respectively) was identified in a previous study (Espeut et al., 2015). All P values were calculated from unpaired two-tailed t tests; ns = not significant, ** = P < 0.01, **** = P < 0.0001.

