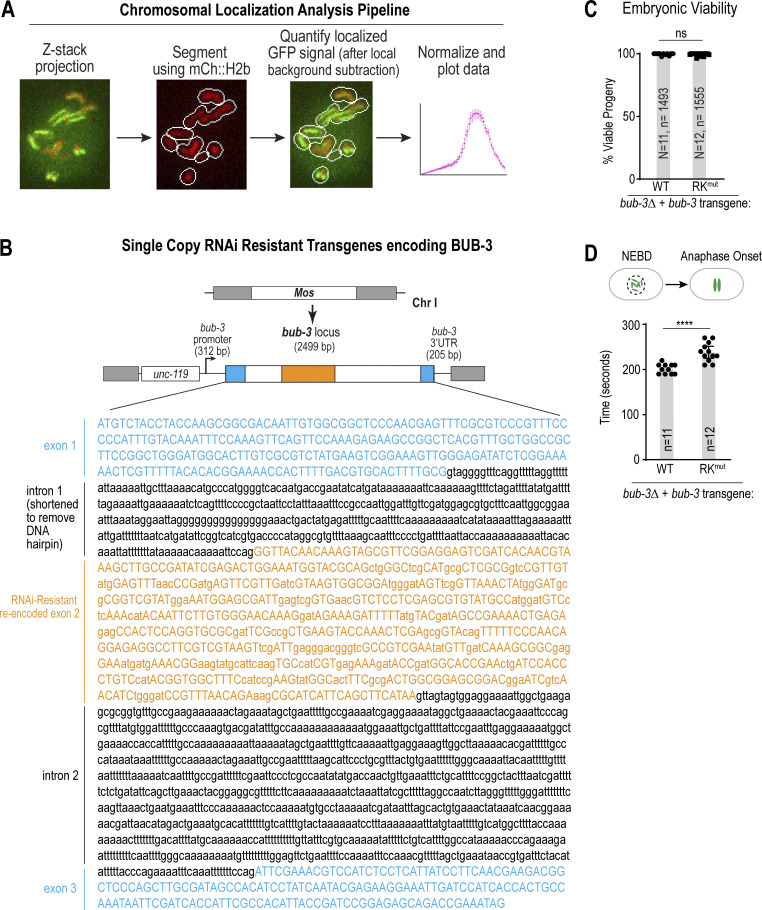
Figure S4.
Image analysis approach to quantify chromosomal localization, design of the RNAi-resistant bub-3 transgene, and additional phenotypic analysis of RKmut BUB-3. (A) Overview of CellProfiler-based analysis to segment chromosomes based on the mCh::H2b signal and measure chromosomal GFP fluorescence. A Laplacian of Gaussian function was applied to the maximum intensity projection of mCh::H2b images in the timelapse sequence to identify chromosomes and expand a region around them. The GFP signal within the segmented regions was quantified, and the region was further expanded by three pixels to subtract the local background. The process was applied to each time point to generate dynamic chromosomal localization curves for each condition. (B) Schematic of RNAi-resistant bub-3 transgenes. Exon 2 was re-encoded to preserve coding information but make the transgene-encoded mRNA resistant to RNAi triggered by a dsRNA raised to the endogenous sequence. In addition, intron 1 was shortened to remove a DNA hairpin. (C) Embryonic viability was quantified for each of the indicated conditions. N is the number of worms and n is the number of progeny scored. (D) The interval from NEBD-anaphase onset was quantified for each of the indicated conditions in one cell C. elegans embryos. n refers to the number of embryos imaged. All P values were calculated by unpaired two-tailed t tests; ns = not significant, **** = P < 0.0001.

