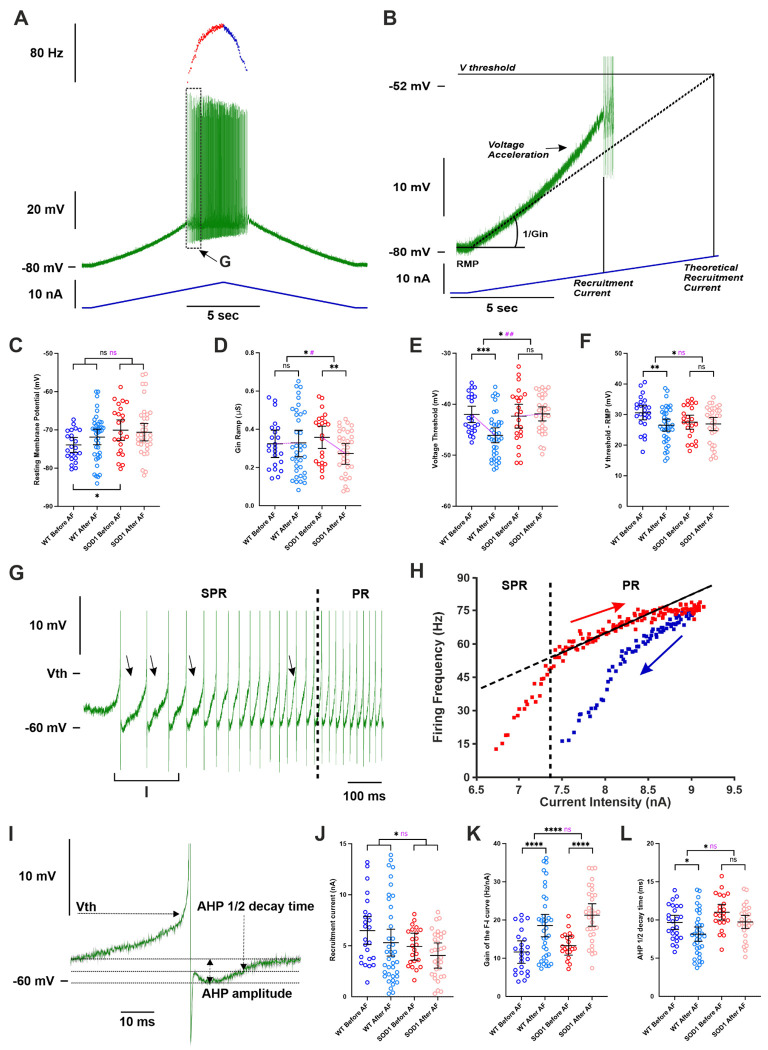
Figure 4 |. Acute delivery of adrenergic β2/β3 agonists increases the firing of motoneurons in WT and SOD1 mice.
A) Representative response of a SOD1 MNs to a slow ramp (1 nA.s−1) of current. Ramp of current (blue bottom trace), voltage response (green middle trace) and instantaneous firing frequency (top trace with ascending leg in red and descending leg in blue). B) Magnification of the ramp subthreshold voltage (green top trace) and current (blue bottom trace). The recruitment current is the minimum intensity to elicit a spike, while the theoretical recruitment current is the current intensity that would be needed to reach the voltage threshold (V threshold) if the MNs had no voltage acceleration and was a purely passive resistor (1/Gin). Effect of an acute delivery of Amibegron/Formoterol on resting membrane potential (C), ramp input conductance (D), voltage threshold for spiking (E), voltage threshold - resting membrane potential (F), recruitment current (J), Gain of the F-I relationship (K), AHP half-decay time (L) in MNs from WT and SOD1 mice. Magnification of the voltage trace from the region indicated in A. At the firing onset, oscillations (arrowheads) appear in the interspike intervals, which characterizes the subprimary range (SPR). When the injected current increases oscillations disappear, reducing the firing variability and increasing the firing frequency linearly, which characterizes the primary range (PR). H) Plot of the instantaneous firing frequency against the intensity of current for the ascending (red) and descending (blue) legs of the ramp shown in A. The F-I relationship displayed a clockwise hysteresis. Vertical dashed line indicates the transition between the SPR and the PR on the ascending leg. The gain of the F–I curve can be estimated by the slope of the linear regression (continuous line) in the PR. I) Average of the three first action potentials indicated in G. The AHP half-decay time is the time between AHP peak amplitude and where the AHP relaxed to half its amplitude. In all graphs, each point represents one MN and the mean ± 95% CI are shown. Significances on top bars are for treatment effects (black) or interaction effects (magenta). Post-hoc significances are shown for WT before AF vs. WT after AF (treatment effect in WT), SOD1 before AF vs. SOD1 after AF (treatment effect in SOD1) and for WT before AF vs. SOD1 before AF (genotype effect before treatment, bottom bar). Amibegron + Formoterol (AF). N = 6 WT mice and N = 11 SOD1 mice. *p<0.05, **p<0.01, ***p<0.001, ****p<0.0001, ns - non significant.

