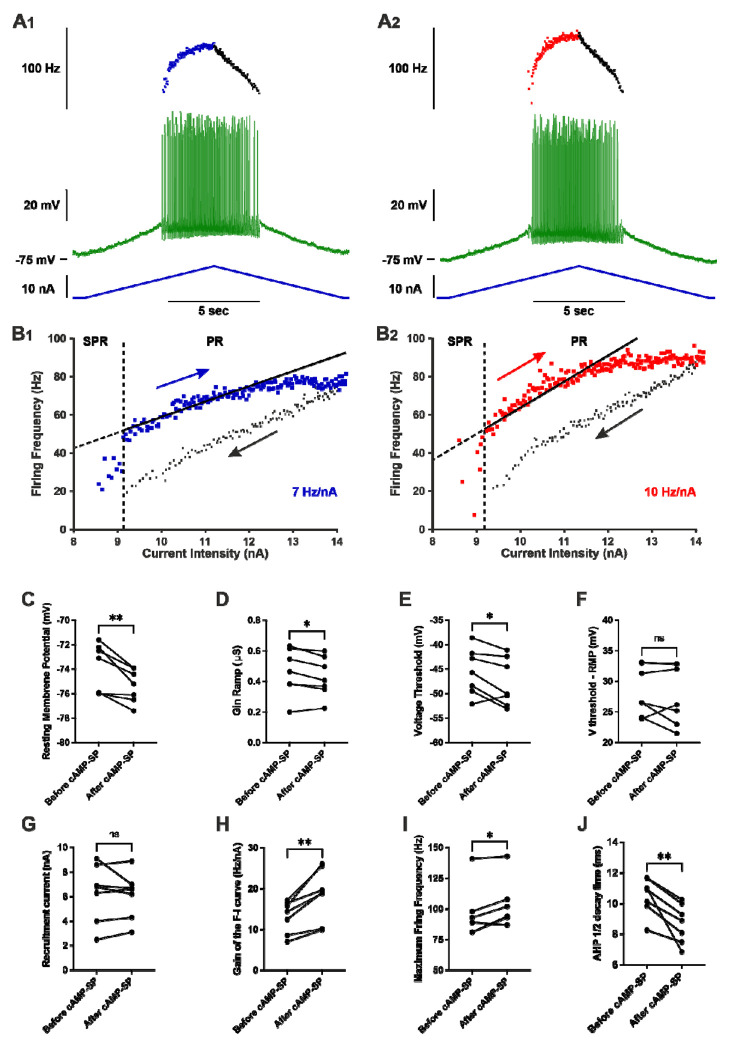
Figure 5 |. Punctual and direct activation of cAMP/PKA pathway increases the firing of motoneurons in SOD1 mice.
A) Representative response of a SOD1 MNs to a slow ramp (2nA/s) of current, before (A1) and 12 minutes after (A2) the iontophoretic injection of cAMP-SP in the same MNs. The ramp of current (blue bottom trace), voltage response (green middle trace) and instantaneous firing frequency (top trace with ascending leg in blue for A1 or red for A2, and descending leg in black for both A1 and A2. B) Plot of the instantaneous firing frequency against the intensity of current for the ascending (blue for B1 or red for B2) and descending legs (black for both B1 and B2) of the ramps shown in A. The F-I relationships displayed a clockwise hysteresis. Vertical dashed line indicates the transition between the SPR and the PR on the ascending branch. The gain of the F–I relationship can be estimated by the slope of the linear regression (continuous line) in the PR. C-J) Comparison of electrophysiological properties extracted from the slow ramp of current before and after injection of cAMP-SP. Before values are measured just before the injection; After values are averages of the recordings repeated after the iontophoretic injection of cAMP-SP; n=7 MNs recorded in N = 7 SOD1 mice. C) Resting membrane potential. D) Ramp input conductance. E) Voltage threshold for spiking. F) Voltage threshold - resting membrane potential. G) Recruitment current. H) Gain of the F-I curve. I) Maximum firing frequency reached at the end of the ascending ramp (the velocity and amplitude were the same for all ramps in each MNs). J) AHP half-decay time. In all graphs, each linked two points represent one MN. Before vs. after values were compared using a paired t-test except for maximum firing frequency, for which a Wilcoxon paired test was used. *p<0.05, **p<0.01, ns - non significant.

