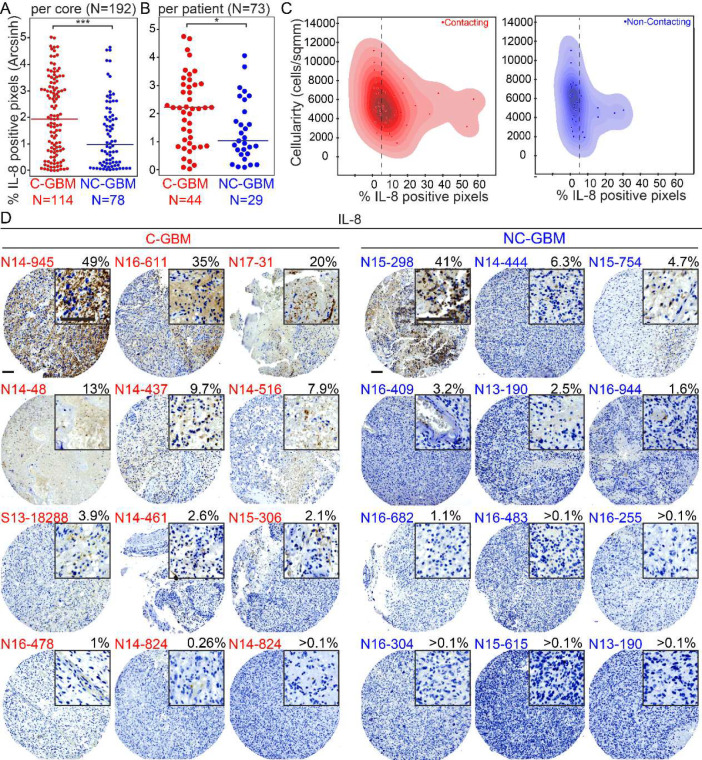
Figure 4 – IL-8 is expressed in primary contacting tumors and less abundantly expressed in non-contacting tumors.
A) Dot plot comparing the percentage of positive pixels per core stained for IL-8 in contacting (N=114) and non-contacting (N=78) GBM tumor cores. 3 cores of each patient sample were included for a total of 192 cores. A Mann Whitney statistical test was used to analyze the difference in immunohistochemical staining of IL-8 between the two groups. *** indicates p < 0.001. B) Dot plot graph comparing the average percentage of positive pixels per patient (N=73) stained for IL-8 in contacting (N=44) and non-contacting (N=29) GBM tumors. A Mann Whitney statistical test was used to analyze the statistical difference in immunohistochemical staining of IL-8 between the two groups. * Indicates p < 0.05. C) Dot plot comparing number of cells per mm2 (on an arcsinh scale) to percentage of positive IL-8 pixels for each patient. Contacting tumors are displayed in red and non-contacting tumors are displayed in blue. D) Representative immunohistochemistry images of CXCL8 (IL-8) expression on glioblastoma tumor microarray (TMA) (12 Contacting tumor examples shown with red labels and 12 Non-Contacting tumor examples shown with blue labels). Top right corner of each image contains 3x zoomed in view (scale bar=100μm).

