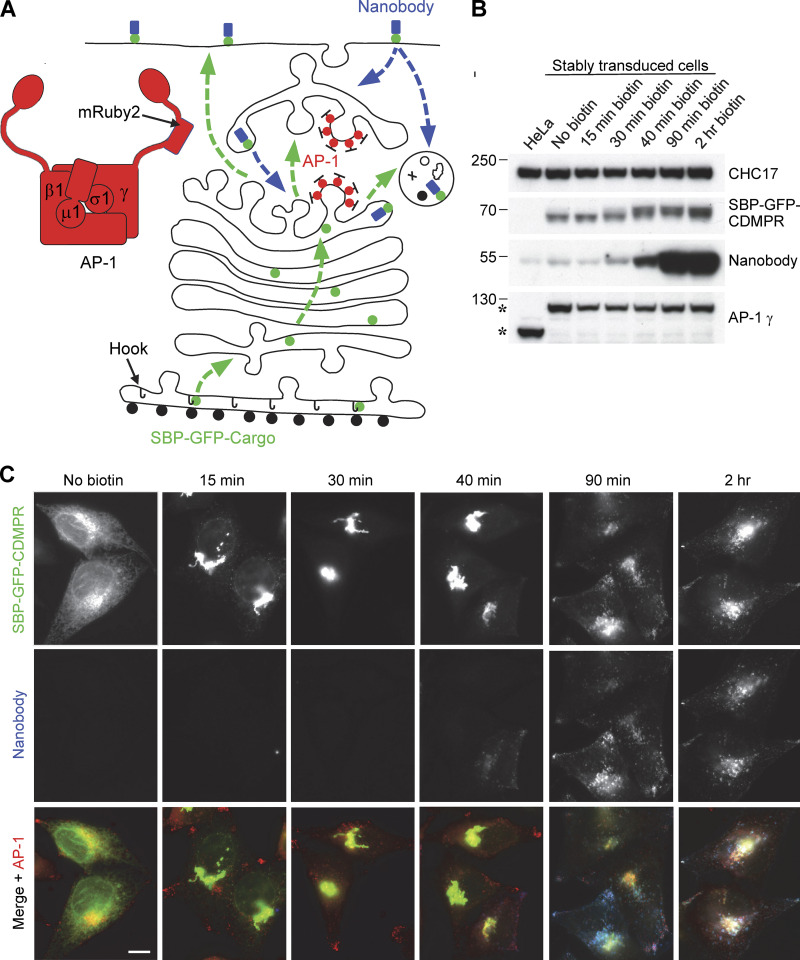
Figure 2.
System for investigating outgoing and incoming membrane traffic. (A) Schematic diagram of the system. A HeLa cell line was generated in which the endogenous AP-1 γ-adaptin subunit, encoded by AP1G1, was replaced by a mRuby2-tagged version. The cells were then stably transduced with a “Hook” construct, consisting of streptavidin with a KDEL sequence for ER retention, and one or more candidate cargo constructs, containing streptavidin-binding peptide (SBP) to keep the constructs in the ER until the addition of biotin. Most of these constructs were also tagged with GFP so that their appearance at the plasma membrane and subsequent endocytosis could be monitored with an anti-GFP nanobody. The green dotted lines with arrows show the pathways that might be taken by the SBP-GFP-cargo proteins after the addition of biotin, and the blue dotted lines with arrows show the pathways that might be taken by the nanobody after it has bound to SBP-GFP-cargo proteins on the cell surface. (B) Western blot of cells shown schematically in A, in which the SBP- and GFP-tagged cargo protein was the cation-dependent mannose 6-phosphate receptor (CDMPR). Addition of biotin causes a shift in the mobility of SBP-GFP-CDMPR (visualized with anti-GFP) as it moves through the Golgi apparatus. HaloTag-conjugated nanobody was added to all the cells for the final 30 min and it started to show a clear increase above background levels (which is most likely due to fluid-phase uptake) after 40 min in biotin. The AP-1 γ subunit is expressed at similar levels in the wild-type and transduced cells, but it has different mobilities (asterisks) because of the presence or absence of the mRuby2 tag. Clathrin heavy chain (CHC17) was used as a loading control. (C) Fluorescent images of the cells shown in B. After 15 min in biotin, most of the SBP-GFP-CDMPR has moved from the ER to the Golgi region, and it stays mostly Golgi-localized until after 40 min. Endocytosed nanobody starts to be detectable at 40 min. Scale bar: 10 μm. Source data are available for this figure: SourceData F2.

