Figure 4.
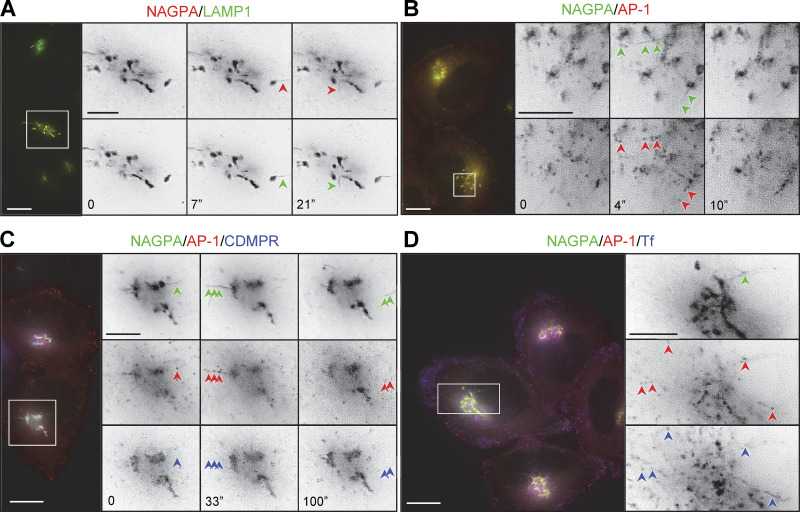
Live imaging of cells coexpressing mRuby2-tagged AP-1 and one or more tagged membrane proteins. (A) Frames from Video 1, showing cells co-expressing SBP-HaloTag-NAGPA (red) and SBP-GFP-LAMP1 (green), treated with biotin for 20 min. LAMP1 and NAGPA can be seen leaving the Golgi in the same tubules (arrowheads). The number of seconds between frames is indicated. Scale bar: 10 μm. (B) Frames from Video 2, showing cells coexpressing mRuby2-AP-1 (red) and SBP-GFP-NAGPA (green), treated with biotin for 33.5 min. NAGPA-positive tubules are decorated with AP-1 puncta. The number of seconds between frames is indicated. Scale bar: 10 μm. (C) Frames from Video 3 show cells coexpressing mRuby2-AP-1 (red), SBP-HaloTag-NAGPA (green), and SBP-GFP-CDMPR (blue), treated with biotin for 27 min. Although most of the CDMPR leaves the Golgi in vesicles rather than tubules, small amounts of CDMPR can sometimes be seen in NAGPA-positive tubules. These tubules are frequently decorated with AP-1 puncta (arrowheads). The number of seconds between frames is indicated. Scale bar: 10 μm. (D) A frame from Video 5, showing cells coexpressing mRuby2-AP-1 (red) and SBP-GFP-NAGPA (green), fed far-red transferrin (blue) for 1 h, and treated with biotin for 27 min. AP-1 puncta can be seen on both NAGPA-positive tubules (upper right arrowhead) and transferrin-positive tubules (other arrowheads). Transferrin-containing tubules at the cell periphery are frequently decorated with AP-1 puncta (see also Video 6). Scale bars: 10 μm for color images, 5 μm for black and white images.

