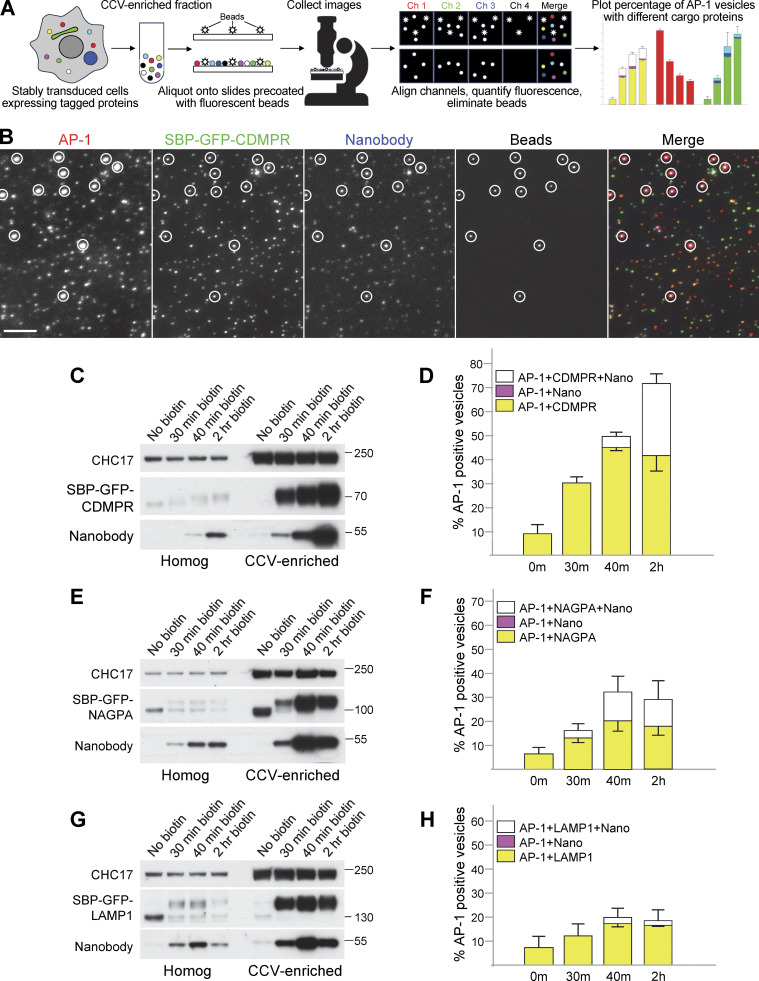
Figure 5.
Single vesicle analysis of cells coexpressing mRuby2-tagged AP-1 and GFP-tagged membrane proteins. (A) Overview of the technique. A CCV-enriched fraction is prepared from stably transduced cells and aliquoted onto slides that were precoated with 100-nm beads. The beads fluoresce in four wavelengths and are used as fiducial markers for channel alignment. Widefield images are collected in four channels and analyzed using a newly written script. The analysis includes channel alignment, quantification of fluorescence in each spot, and elimination of the beads, which are the only particles that fluoresce in Channel 4. Data are plotted as the percentage of AP-1-containing spots (Channel 1) that also contain another protein or proteins. (B) A CCV-enriched fraction was prepared from cells co-expressing mRuby2-tagged AP-1 and SBP-GFP-tagged CDMPR, treated with biotin for 2 h, and incubated with HaloTag-conjugated nanobody for the final 30 min. Aliquots were spotted onto slides that had been precoated with beads. The figure shows cropped images in each wavelength, with the beads circled. The full image can be seen in Fig. S2. AP-1 fluoresces in red, CDMPR in green, and nanobody in far-red, shown as blue in the merged image. Scale bar: 5 μm. (C) Western blot from an experiment similar to the one in B, showing the whole cell homogenate and CCV-enriched fractions for four different time points in biotin. CHC17 was used as a loading control. (D) Single vesicle analysis of the experiment is shown in C. The data represent the means from three independent pooled experiments, with at least 10 images analyzed in each experiment for each condition, and 1,000–10,000 discrete spots per image. The error bars indicate the standard deviation. The presence of CDMPR in AP-1 vesicles continues to increase throughout the time course, so that by 2 h in biotin, about three-quarters of the AP-1 vesicles contain detectable CDMPR, and nearly half of these also contain detectable endocytosed nanobody. There are no vesicles containing nanobodies that do not also contain CDMPR, as expected because the nanobody enters the cell by piggybacking on the CDMPR. Complete datasets for all the single vesicle analysis experiments are shown in Fig. S3. (E) Western blot of cell homogenates and CCV-enriched fractions from cells expressing SBP-GFP-NAGPA, treated with biotin for varying lengths of time and incubated with nanobody for the final 30 min. CHC17 was used as a loading control. (F) Single-vesicle analysis of the experiment is shown in E. The data represent the means from three independent pooled experiments, with at least 10 images analyzed in each experiment for each condition, and 1,000–10,000 discrete spots per image. The error bars indicate the standard deviation. The presence of NAGPA in AP-1 vesicles plateaus at 40 min, with about one-third of the AP-1 vesicles containing detectable NAGPA. Nearly half of these also contain detectable endocytosed nanobody, which accumulates more quickly in NAGPA-expressing cells than in CDMPR-expressing cells, consistent with NAGPA leaving the Golgi in LAMP1-positive tubules (see Fig. 4 A). (G) Western blot of cell homogenates and CCV-enriched fractions from cells expressing SBP-GFP-LAMP1, treated with biotin for varying lengths of time and incubated with nanobody for the final 30 min. CHC17 was used as a loading control. (H) Single-vesicle analysis of the experiment shown in G. The data represent the means from three independent pooled experiments, with at least 10 images analyzed in each experiment for each condition, and 1,000–10,000 discrete spots per image. The error bars indicate the standard deviation. Relatively little LAMP1 accumulates in AP-1 vesicles. Source data are available for this figure: SourceData F5.

