Figure 6.
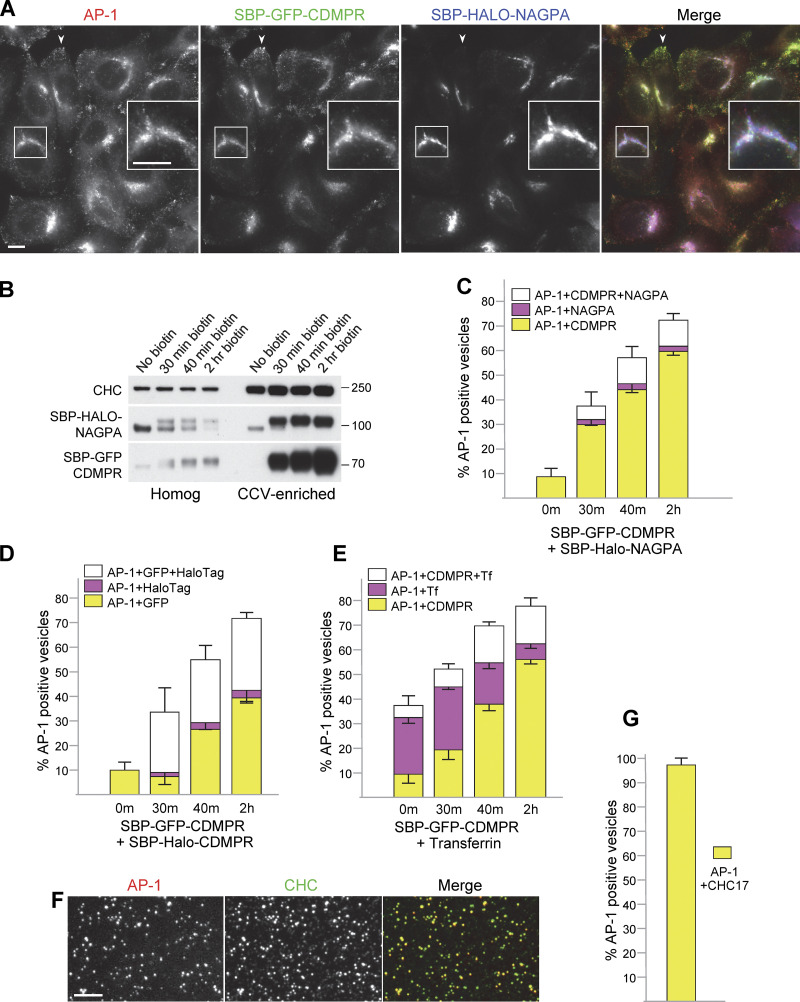
Heterogeneity of AP-1 vesicles. (A) Fluorescent images of cells coexpressing SBP-GFP-CDMPR and SBP-HaloTag-NAGPA after 90 min in biotin. Although both localize to juxtanuclear membranes, the fine details are different (inset), and only CDMPR localizes to peripheral membranes, where AP-1 is also found (arrowheads). Scale bars: 10 μm. (B) Western blot of cells co-expressing SBP-GFP-CDMPR and SBP-HaloTag-NAGPA, showing the whole cell homogenate and CCV-enriched fractions for four different time points in biotin. CHC17 was used as a loading control. (C) Single-vesicle analysis of the experiment shown in B. The data represent the means from three independent pooled experiments, with at least 10 images analyzed in each experiment for each condition, and 1,000–10,000 discrete spots per image. The error bars indicate the standard deviation. Most of the NAGPA-containing AP-1 vesicles (∼80%) also contain CDMPR, but not vice versa. The percentages are deduced from the white and magenta portions of the bars: in every case, the white portion is ∼4× taller than the magenta portion. (D) Single vesicle analysis of cells co-expressing SBP-GFP-CDMPR and SBP-HaloTag-CDMPR, showing the means from three independent pooled experiments, with at least 10 images analyzed in each experiment for each condition, and 1,000–10,000 discrete spots per image. The error bars indicate the standard deviation. The differences are most likely due to differences in expression levels because the localization patterns of SBP-GFP-CDMPR and SBP-HaloTag-CDMPR are virtually identical (see Fig. S4 B). (E) Single vesicle analysis of cells expressing SBP-GFP-CDMPR, treated with biotin for various lengths of time, and in every case fed far-red transferrin for 1 h and then processed immediately. The data represent the means from three independent pooled experiments, with at least 10 images analyzed in each experiment for each condition, and 1,000–10,000 discrete spots per image. The error bars indicate the standard deviation. The percentage of AP-1 vesicles that contain both CDMPR and transferrin increases with time in biotin. (F) Fluorescent image of the CCV-enriched fraction from cells expressing mRuby2-tagged AP-1 and labeled after fixation with an antibody against CHC17. Scale bar: 5 μm. (G) Single-vesicle analysis of experiments similar to the one shown in F, with at least 10 images analyzed in each of three experiments, and 1,000–10,000 discrete spots per image. The error bars indicate the standard deviation. Nearly all of the AP-1 vesicles are also positive for CHC17. Source data are available for this figure: SourceData F6.

