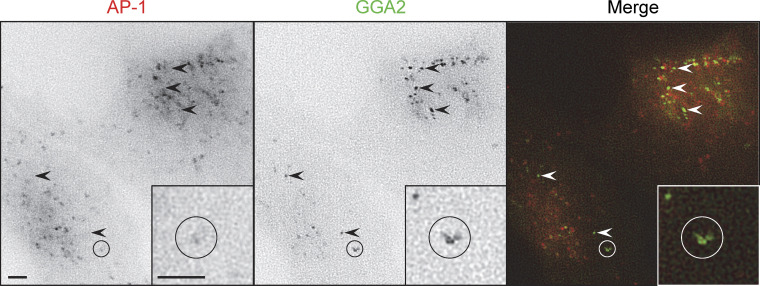
Figure 7.
Stills from Video 7 showing cells co-expressing mRuby2-tagged AP-1 and GFP-tagged GGA2. Arrowheads indicate some of the puncta that are positive for GGA2 only. The circled area indicates a moving structure that is positive for both AP-1 and GGA2, but the two localize to different regions. Scale bars: 2 μm.

