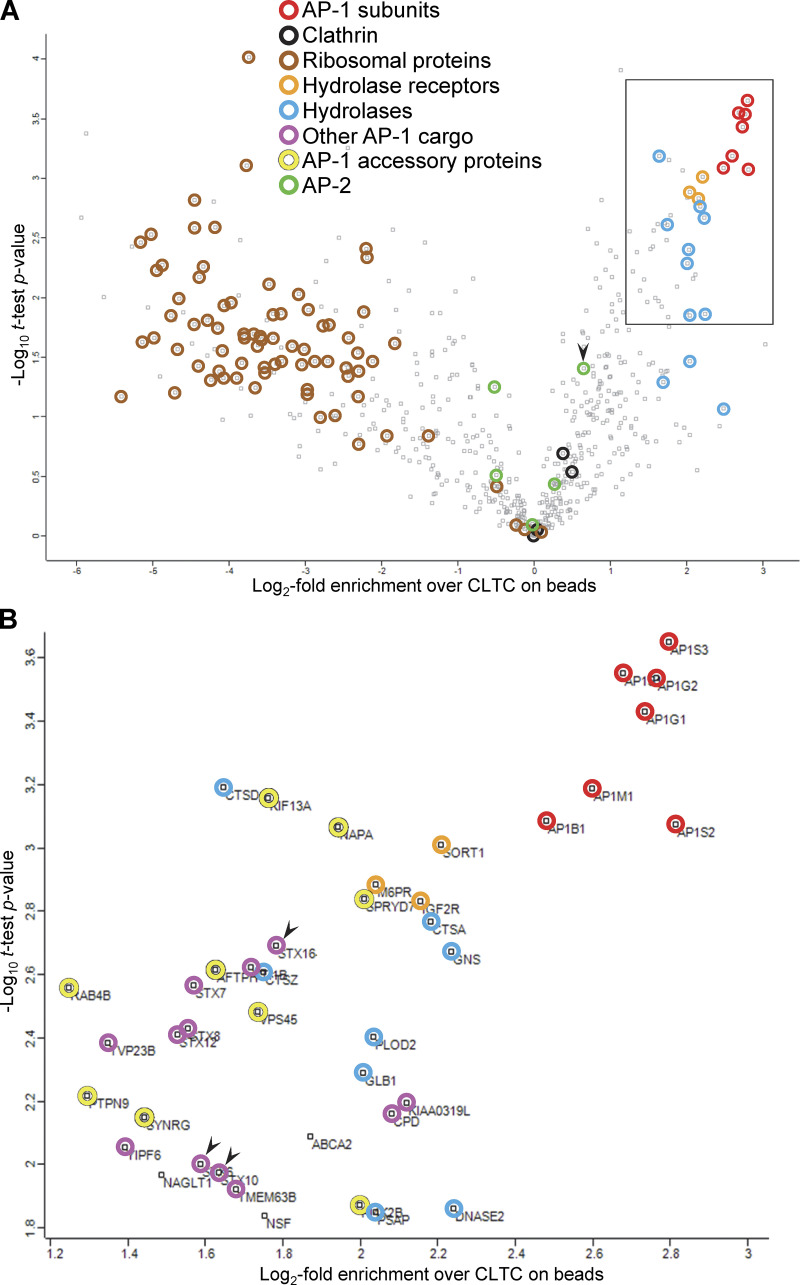
Figure 9.
Proteomic analysis of the bead-captured samples. CCV-enriched fractions were prepared from HeLa cells expressing mRuby2-tagged AP-1 γ, grown in either SILAC heavy (H) or SILAC light (L) medium. AP-1-positive vesicles were captured from the H fraction before the final centrifugation step, while the L fraction was centrifuged to provide an input reference. Heavy-to-light ratios were calculated as a measure of enrichment in the bead-captured samples over the input and statistical analysis was performed for 632 proteins that passed quality control. (A) Data are presented as a volcano plot. For each protein, a one-sample t test was performed against a hypothetical ratio defined as the mean ratio for CLTC, the most abundant protein in both the H and L samples (see Fig. S5). The proteins on the right side of the plot are potential components of AP-1 vesicles, with the most enriched hits being AP-1 subunits. The three hydrolase receptors and various hydrolases also score highly. Proteins on the left side are unlikely to be components of AP-1 vesicles, and they include ribosomal proteins. AP-2 subunits are generally to the left of clathrin, with the exception of AP2B1 (arrowhead), which is known to associate promiscuously with AP-1 (Page and Robinson, 1995). Other AP-1 cargo and accessory proteins are not indicated in this plot. (B) Protein identities in the boxed region in A, which contains the most enriched hits. The proteins shown in color were also hits in our previous knocksideways analyses (Hirst et al., 2012, 2015). The arrowheads indicate the syntaxins STX6, STX10, and STX16. The complete dataset is available in Table S1. Table S2 contains proteomic data from unlabeled cells, in which the CCV-enriched fraction was incubated with beads coated with either anti-mRuby or preimmune serum, as further confirmation of the specificity of the AP-1 vesicle capture.

