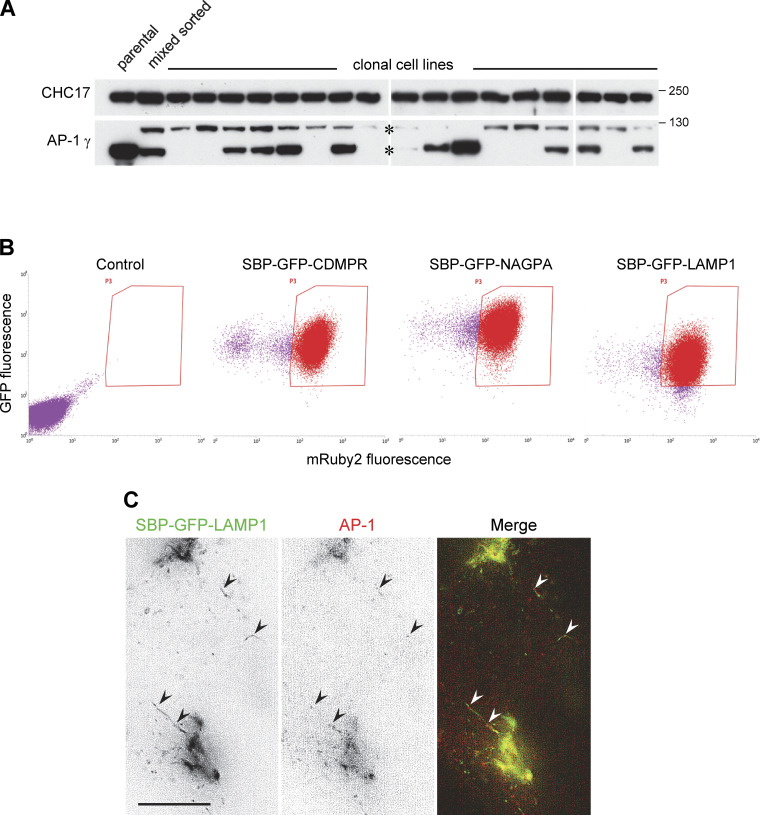
Figure S1.
Generation and characterization of cell lines and cell populations. (A) Initially, we attempted to tag the AP-1 γ subunit with mRuby2 using gene editing. Positive cells were sorted by flow cytometry and then individual clonal cell lines were isolated and analyzed by Western blotting. The blots show that although the tagging was successful, expression levels for the tagged protein (upper band) were always much lower than that of the wild-type protein in the parental HeLa cells. This is most likely because the gene we tagged, AP1G1, is present in multiple copies, and only very few were tagged in each cell line, while the others were frequently disrupted by indels. (B) After generating a clonal cell line in which the tagged AP-1 γ subunit was introduced by retroviral transduction and the endogenous gene was then deleted using gene editing, we added additional tagged membrane proteins using retroviral transduction. Cells were selected by flow cytometry and then routinely sorted by flow cytometry before scaling up for CCV isolation experiments. The dot plots show that there was some loss of mRuby2-tagged AP-1 γ with time and that although the three membrane proteins were under the control of the same LTR promoter and were sorted using the same gates, there were inherent differences in expression levels, with SBP-GFP-NAGPA being most strongly expressed, followed by SBP-GFP-CDMPR and then SBP-GFP-LAMP1. (C) Frames from Video 4, showing cells co-expressing SBP-HaloTag-NAGPA (red) and SBP-GFP-LAMP1 (green), treated with biotin for 28 min. Some of the LAMP1-containing tubules are decorated with AP-1, indicating that the presence of AP-1 on these tubules is not simply a consequence of overexpressing the AP-1 cargo protein NAGPA. Scale bar: 10 μm. Source data are available for this figure: SourceData FS1.

