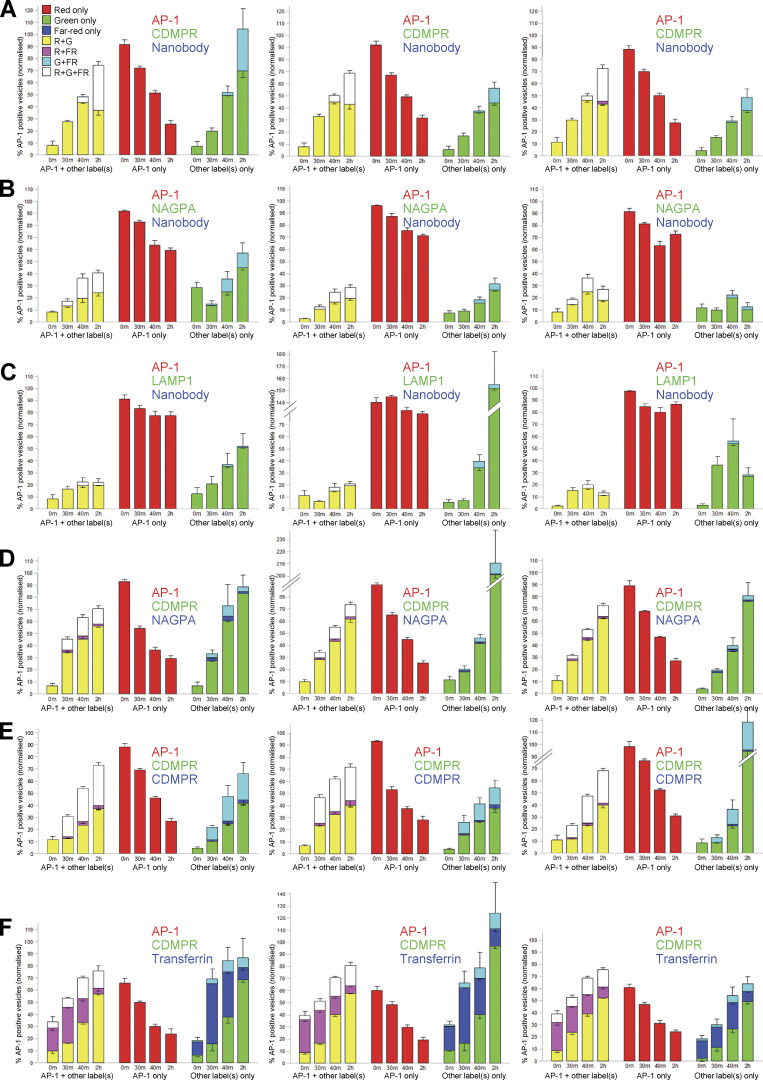
Figure S3.
Results from all 18 of the experiments used for single vesicle analysis. Three biological repeats were carried out for each condition. All of the cells used in these experiments expressed mRuby2-tagged AP-1 (red) but their GFP-tagged and far-red proteins were different (shown in green and blue, respectively). The key in the upper left shows the different combinations of labels, based on how they appear in the images (e.g., R+G for red and green only, shown as yellow; R+FR for red and far-red only, shown as magenta, etc.). On the actual graphs, the right-hand “AP-1 + other label(s)” portions (R+G/yellow, R+FR/magenta, and R+G+FR/white) were used to generate Figs. 5 and 6. The middle portion of each graph (red) shows the percentage of vesicles that were positive for AP-1 only. The right-hand portions (G, FR, G+FR/cyan) show vesicles that were negative for AP-1 but positive for other fluorescent proteins. These were normalized to total AP-1-containing vesicles, and thus there are some instances where the percentage is >100. Although the AP-1-containing vesicles were very consistent between experiments, there was much more variability in non-AP-1 puncta. The error bars indicate the standard deviation.

