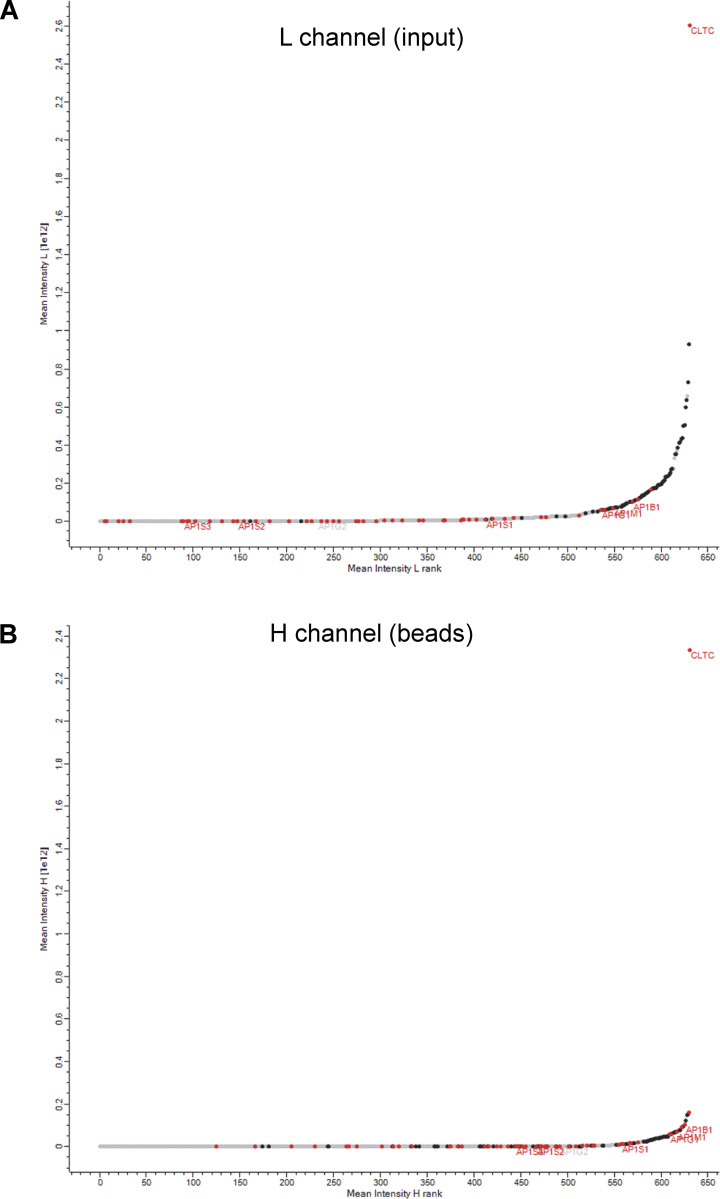
Figure S5.
Protein rank plots. The graphs show the mean rank (0 is lowest intensity) versus the mean log10 intensity for each of the 632 proteins analyzed in Fig. 9. The L (light) channel is the input, i.e., the total CCV-enriched fraction, while the H (heavy) channel is the bead-captured proteins. CHC17 (CLTC) is the most abundant protein in both channels and ribosomal proteins (black) are also abundant in both channels. However, AP-1, as well as AP-1-associated proteins identified in our previous knocksideways study (red) (Hirst et al., 2012), shift up the rank distribution in the heavy channel. The L (light) channel (A) is the input, i.e., the total CCV-enriched fraction, while the H (heavy) channel (B) is the bead-captured proteins.

