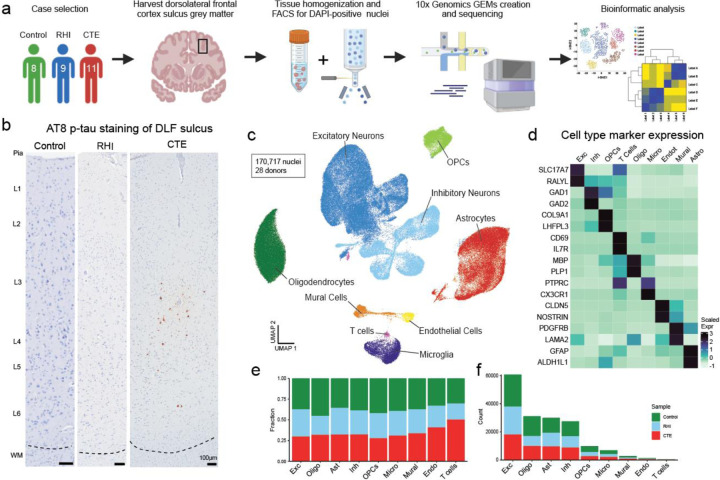
Figure 1. Cell type identification and cell proportion analysis across pathological groups.
a. Diagram depicting experimental workflow. b. AT8 immunohistochemistry of dorsolateral frontal cortex depth of sulci, dashed line represents the grey-white matter interface. Scale bar, 100μm. c. UMAP of nuclei from all donors labelled for cell type based on cell-type marker expression. d. Expression of cell type markers across cell type clusters in (c). e. Stacked bar plot of pathological group fractions within cell type clusters. f. Stacked bar plot of cell type counts colored by pathological group.

