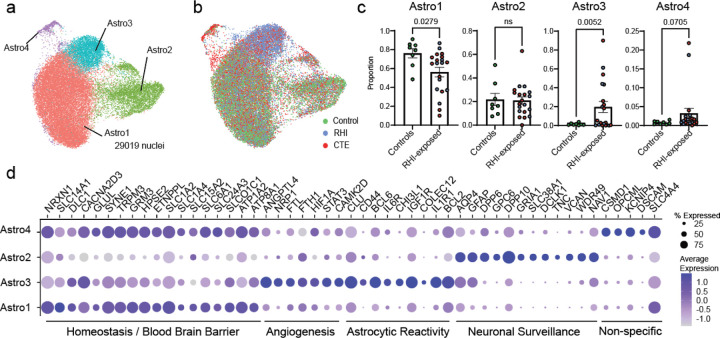
Figure 3. Astrocytic responses to head trauma.
a. UMAP representing 4 astrocytic subtypes. b. UMAP from (a) colored by pathological group. c. Bar plots showing astrocyte subcluster distribution in control and RHI-exposed samples, dots represent individual donors colored by pathological group identity. Bars represent mean, error bars represent standard error of the mean. Statistical analysis was performed using two-tailed Mann Whitney U-test. d. Dot plot representing expression of selected DEGs across astrocytic subtype and annotated by function.

