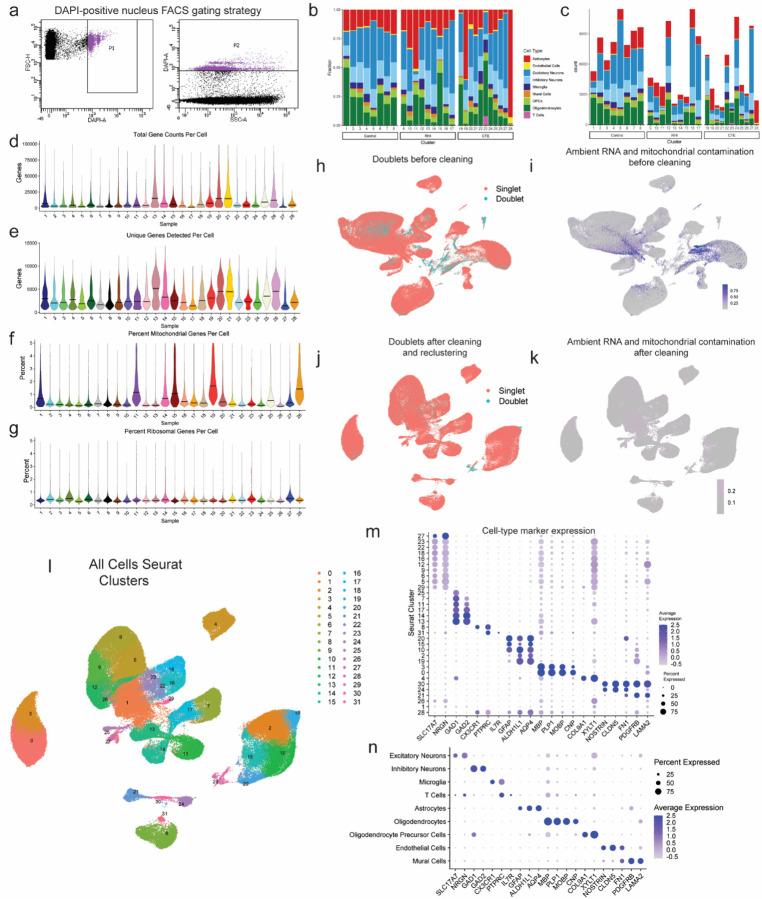
Extended Data Figure 1. Dataset quality control and cell type marker validation.
a. Fluorescence activated cell sorting gating strategy of DAPI-positive nuclei. b. Stacked bar plot representing the proportion of cell type per donor. c. Stacked bar plot representing the cell type counts per donor. d-e. Violin plots for each donor of (d) total gene counts per cell, (e) unique genes detected per cell, (f) percent of mitochondrial genes detected per cell, and (g) percent ribosomal genes detected per cell. Line represents median. h,i UMAP of full dataset before cleaning colored by (h) doublet or singlets or (i) mitochondrial contamination. j,k. UMAP of full dataset after cleaning colored by (j) doublets or singlets or (k) mitochondrial contamination. l. UMAP of full dataset colored by Seurat clusters. m. Dot plot of cell type marker expression across Seurat clusters depicted in (l). n. Dot plot of cell type marker expression in annotated cell type clusters.

