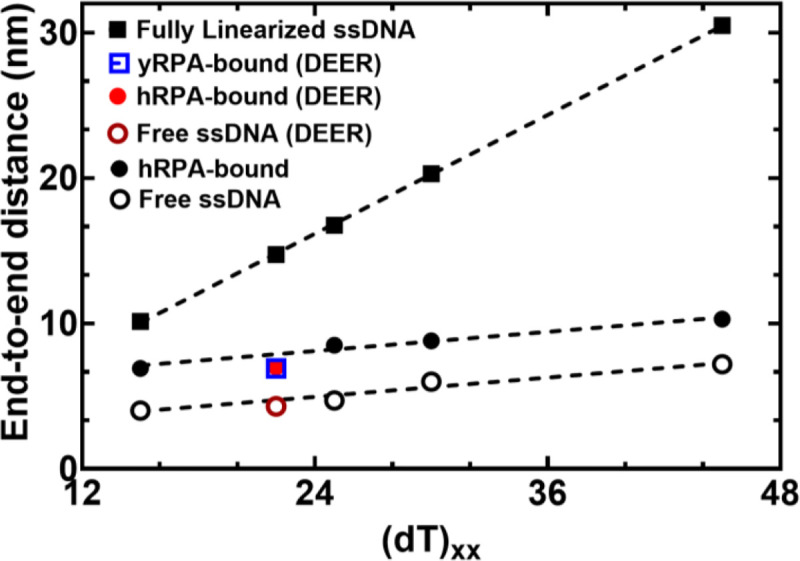
Figure 4. RPA binding produces a modest 2.6 nm increase in end-to-end distance.

The estimated distance between 3’ and 5’ end of ssDNA is plotted as a function of nucleotides which make up the chain. Closed squares represent theoretically calculated end-to-end distances assuming the ssDNA was completely linearized. Open and closed circles represent experimental end-to end distance measurements from smFRET analysis ssDNA −/+ RPA, respectively. The figure also shows that end-to-end distances of yRPA-bound, hRPA-bound, and free (dT)22 ssDNA, measured using DEER spectroscopy, fall on the respective trend lines suggesting good agreement between experimental measurements performed using two independent biophysical approaches.
