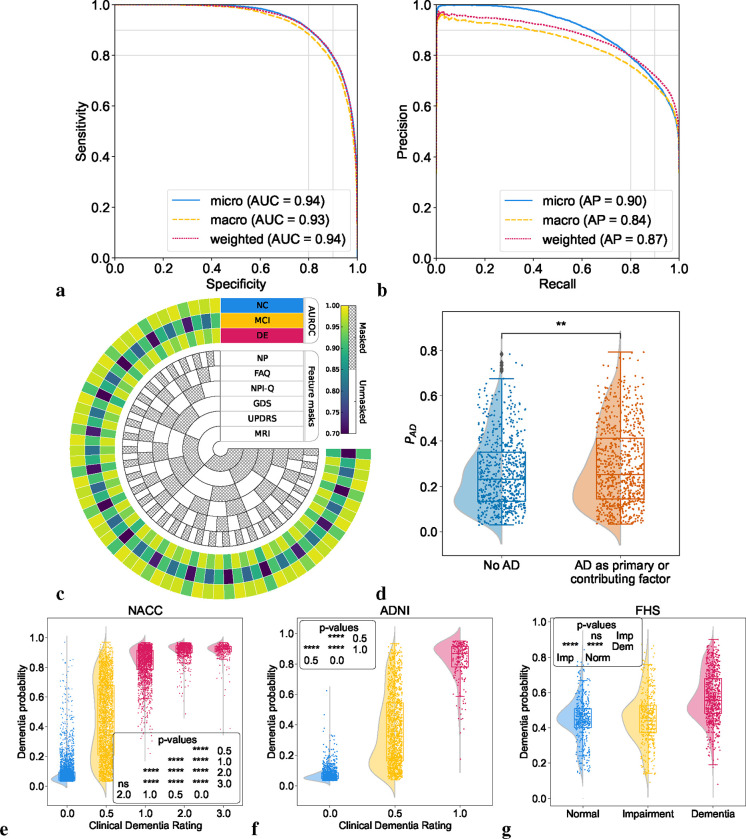
Figure 2: Model performance on individuals along the cognitive spectrum.
(a,b) Receiver operating characteristic (ROC) and precision-recall (PR) curves, with their respective micro-average, macro-average, and weighted-average calculations based on the labels for NC, MCI, and DE. These averaging techniques consolidated the model’s performance across the spectrum of cognitive states. Cases from the NACC testing, ADNI and FHS were used. (c) Chord diagram indicating varied levels of model performance in the presence of missing data. The inner concentric circles represent various scenarios in which particular test information was either omitted (masked) or included (unmasked). The three outer concentric rings depict the model’s performance as measured by the area under the receiver operating characteristic curve (AUROC) for the NC, MCI and DE labels. (d, e, f) Raincloud plots with violin and box diagrams are shown to denote the distribution of clinical dementia rating scores (x-axis) versus model-predicted probability of dementia (y-axis), on the NACC, ADNI and FHS cohorts, respectively. (g) Raincloud plots are used to demonstrate the model’s ability to distinguish between MCI cases in the NACC cohort where AD was a factor for cognitive impairment and those attributed to non-AD etiologies. For plots (d-g), significance levels are denoted as ‘ns’ (not significant) for p ≥ 0.05; * for p < 0.05; ** for p < 0.01; *** for p < 0.001; and **** for p < 0.0001 based on Kruskal-Wallis H-test for independent samples followed by post-hoc Dunn’s testing with Bonferroni correction.

