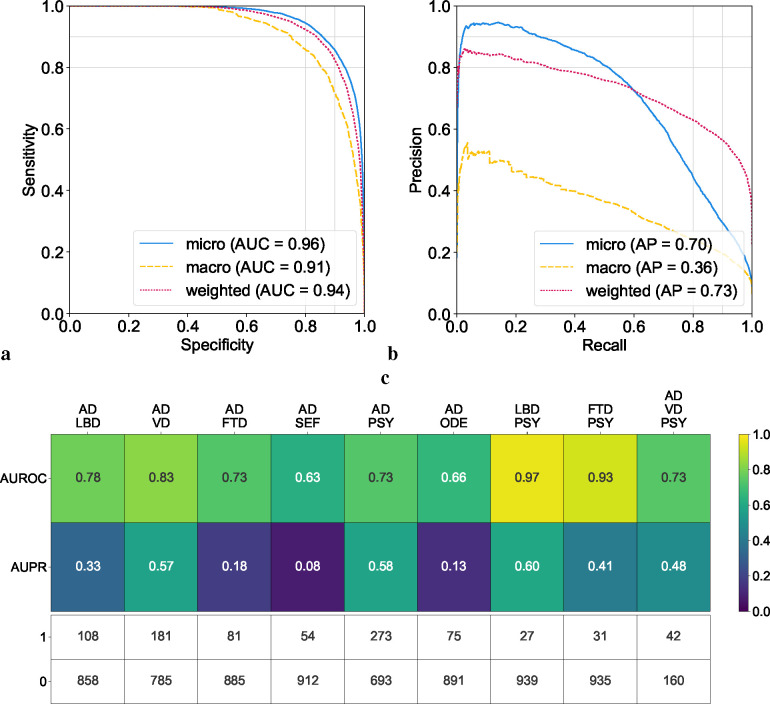
Figure 3: Model assessment on single and co-occurring dementias.
(a, b) Receiver operating characteristic (ROC) and precision-recall (PR) curves are provided, utilizing micro-average, macro-average, and weighted-average methods across all the dementia diagnostic labels. These averages were computed to synthesize the performance metrics across all dementia etiologies. (c) Heatmaps are used to depict the model’s performance on co-occurring dementias. We considered all combinations where two or more etiologies co-occurred from the NACC testing cohort, provided there were at least 25 positive samples. This ensured that the maximum variance of the AUROC calculation over all possible continuous distributions was upper bounded by 0.01.42 The first row shows the AUROC values and the second row shows the AUPR values. The table also displays the sample sizes for each case, with 1 representing a positive case and 0 indicating a negative sample.

