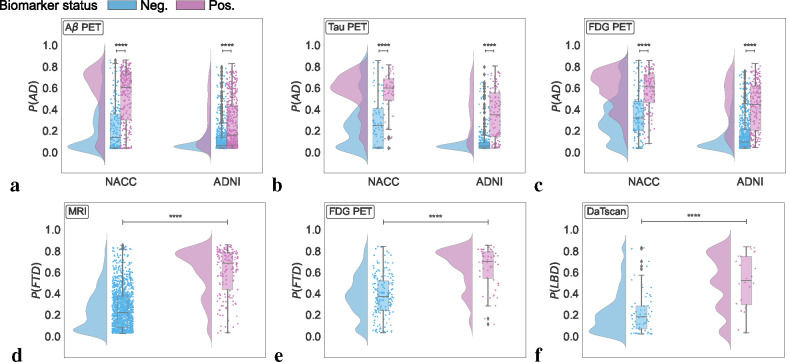
Figure 4: Biomarker-level validation.
Raincloud plots representing model probabilities for dementia etiologies across their respective biomarker negative (blue) and positive groups (pink). (a-c) Model predicted probabilities for Alzheimer’s disease (P(AD)) were analyzed in relation to amyloid ), tau, and fluorodeoxyglucose (FDG) PET biomarkers. Differences between negative and positive groups regarding P(AD) were evaluated using a one-sided Mann-Whitney U test for the NACC cohort and a one-sided t-test for ADNI. Similar analyses for tau and FDG PET biomarkers were conducted using one-sided Mann-Whitney U tests, with **** denoting p < 0.0001. (d-e) For frontotemporal lobar degeneration (P(FTD)), probabilities were assessed across MRI and FDG PET biomarker groups in the NACC cohort, using a one-sided Mann-Whitney U test, marked by **** for p < 0.0001. (f) Lewy body dementia (P(LBD)) probabilities were analyzed between DaTscan negative and positive groups using a one-sided Mann-Whitney U test, with **** indicating p < 0.0001.

