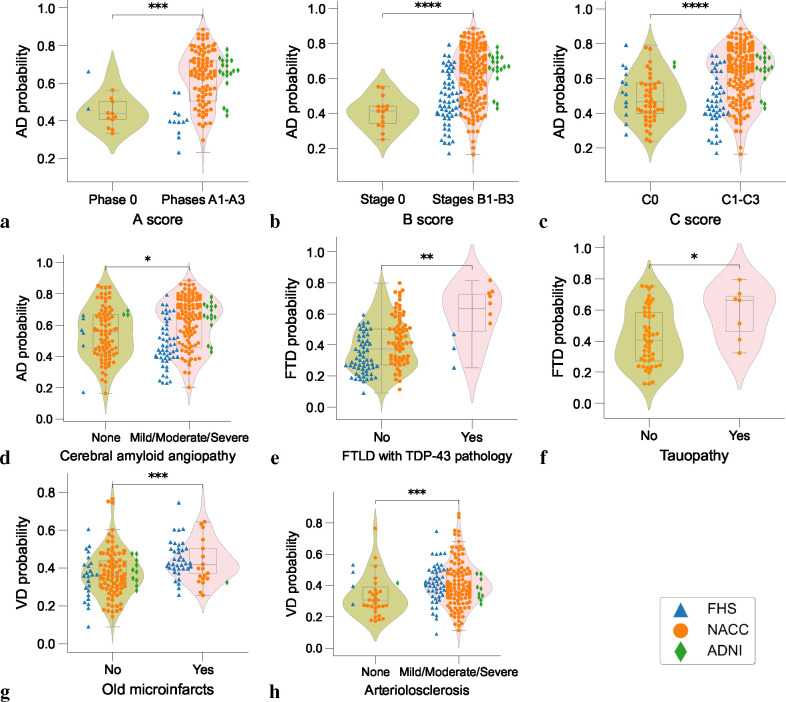
Figure 5: Neuropathological validation.
Array of violin plots with integrated box plots, delineating the probability distributions as predicted by the model for different neuropathological grades. The analysis encompasses data from three distinct cohorts: the Framingham Heart Study (FHS), the National Alzheimer’s Coordinating Center (NACC), and the Alzheimer’s Disease Neuroimaging Initiative (ADNI), each denoted by unique markers (triangles, circles, and diamonds, respectively). Statistical significance is encoded using asterisks, determined by Dunn-Bonferroni post-hoc test: one asterisk (*) for p < 0.05; two asterisks (**) for p < 0.01, three asterisks (***) for p < 0.001, and four asterisks (****) for p < 0.0001, reflecting increasing levels of statistical significance. Table S13 presents more details on the statistics.

