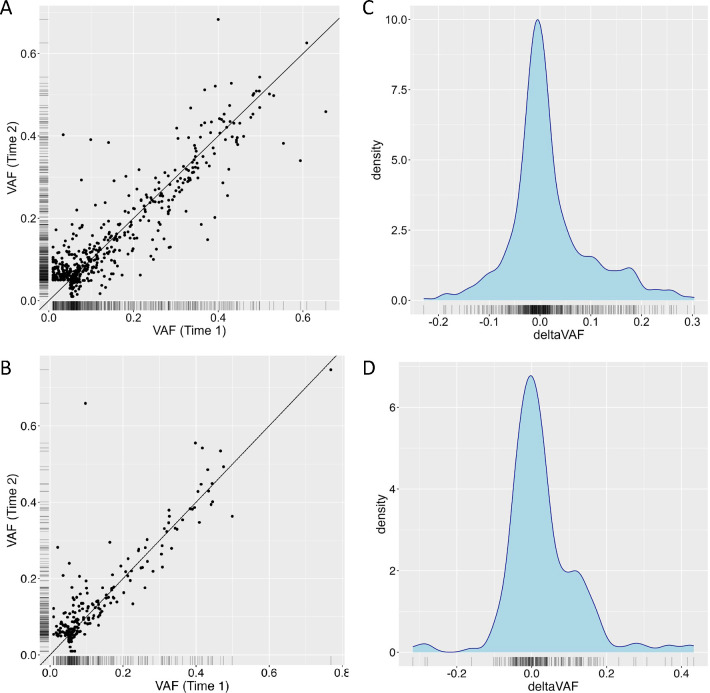
Fig 1. Change in variant allele fraction (VAF) over time.
a,b, Correlation between VAF at the first measurement (x-axis) and the second measurement (y-axis), with the black line indicating perfect correlation, in MESA (top) and RS (bottom). c,d, Distirbution of the change in VAF (deltaVAF) in MESA (top) and RS (bottom).

