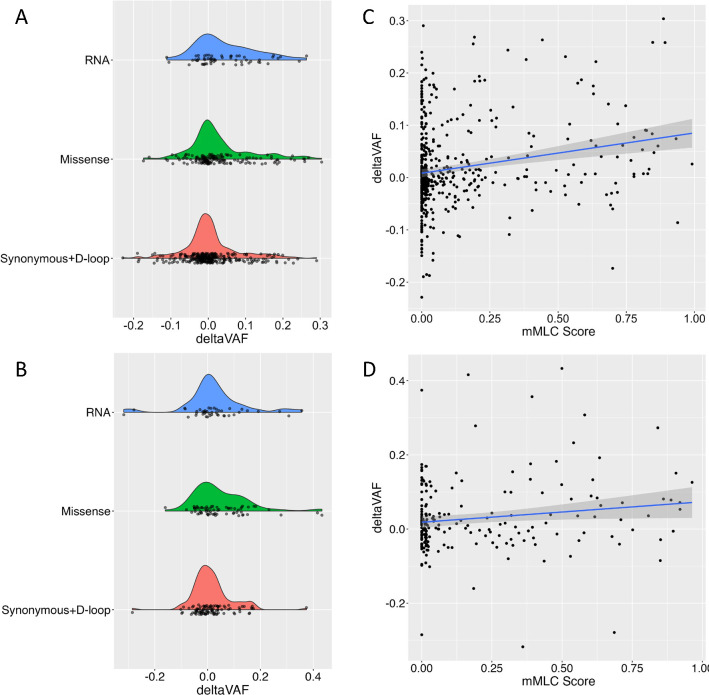
Fig 2. deltaVAF by functional consequence.
a,b, Density plots of deltaVAF stratified by mutation consequences in MESA (top) and RS (bottom). c,d, Correlation between the mMLC score and deltaVAF, with a blue line with confidence intervals illustrating the regression slope in MESA (top) and RS (bottom).

