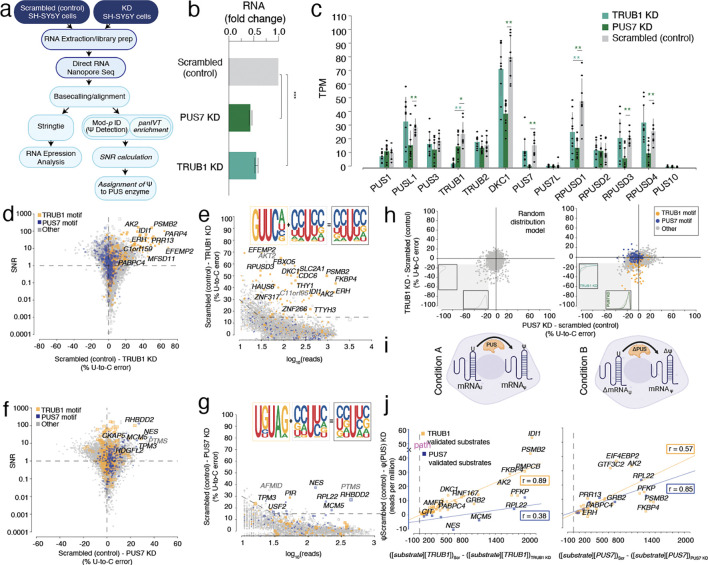
Figure 1. Enzymatic KD of PUS enzymes and DRS is used to determine enzyme-mediated psi-sites.
a. Schematic workflow of siRNA knockdown (KD), DRS, and analysis.
b. The concentration of PUS7 and TRUB1 mRNA in SH-SY5Y cells for the scrambled (control), PUS7 KD, and TRUB1 KD, respectively, following siRNA KD, was quantified by RT-qPCR.
c. TPM of various PUS enzymes following TRUB1 knockdown (KD), PUS7 knockdown (KD), and scrambled (control) determined by DRS. Individual colored bars represent each experimental condition, with error bars describing the standard error of the mean (SEM) across downsampled replicates. Individual replicates are shown as black dots.
d. SNR was calculated using beta-binomial distribution and Jeffrey’s prior, and particular points were plotted against the difference in U-to-C error between the Scrambled (control) and TRUB1 KD. Orange dots represent uridine positions within a TRUB1 motif, and blue dots represent uridine positions within a PUS7 motif.
e. Putative psi-positions determined by Mod-p ID are plotted according to the difference in U-to-C basecalling error in the scrambled (control) and the TRUB1 KD against the reads for each position. The inlet shows the sequencing logo for positions within the TRUB1 motif, grey points above the threshold line, and total points above the threshold line.
f. SNR was calculated using beta-binomial distribution and Jeffrey’s prior, and particular points were plotted against the difference in U-to-C error between the Scrambled (control) and PUS7 KD. Orange dots represent uridine positions within a TRUB1 motif, and blue dots represent uridine positions within a PUS7 motif.
g. Putative psi-positions determined by Mod-p ID are plotted according to the difference in U-to-C basecalling error in the scrambled (control) and the TRUB1 KD against the reads for each position. The inlet shows the sequencing logo for positions within the PUS7 motif, grey points above the threshold line, and total points above the threshold line.
h. (left) Random distribution model of points constrained by the data parameters. Histograms indicate the distribution of points in the lower left quadrant as a function of each simulated knockdown. (right) distribution of TRUB1 KD plotted against PUS7 knockdown. Histograms indicate the distribution of points in the lower left quadrant as a function of each knockdown.
i. (Left) Steady-state model of PUS enzyme concentration affecting psi deposition at a given position. (Right) Steady-state model of the difference in pus concentration between two conditions being proportional to the substrate concentration (transcript).
j. Steady-state PUS enzyme:mRNA substrate correlation with psi levels for knockdown cell lines. Left: plot of number of reads per million that contain U-C mismatches vs. the difference in the product of TRUB1 substrate and the TRUB1 enzyme concentrations between Scrambled and TRUB1 knockdown cell lines (plotted for both TRUB1 and PUS7 sites). Right: Similar plot as in Left, except the comparison was made for PUS7 enzyme concentrations. The lines shown are Pearson correlations with R2 and ρ values indicated in boxes.

