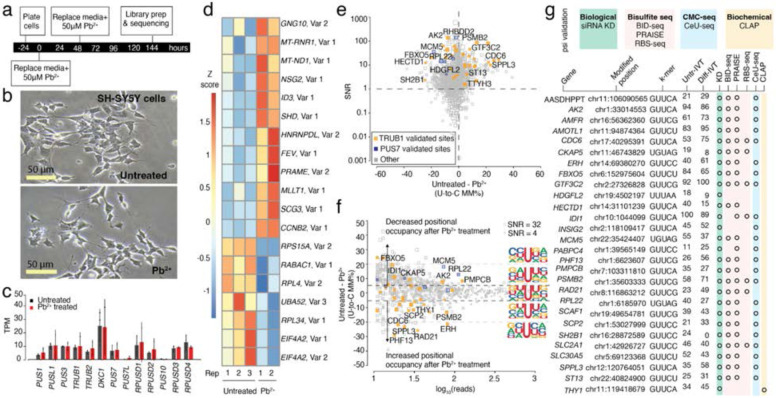
Figure 2. Effects of Pb2+ treatment on mRNA psi modification and machinery in SH-SY5Y cells.
a. Timeline illustrating the stages and duration of the Pb2+ treatment applied to SH-SY5Y cells.
b. A representative photomicrograph of untreated and Pb2+ treated SH-SY5Y cells is shown.
c. DRS determined the TPM of various PUS enzymes in untreated and Pb2+-treated SH-SY5Y cells. Individual colored bars represent each experimental condition, with error bars describing the standard error of the mean (SEM) across downsampled replicates. Individual replicates are shown as black dots. Statistics are performed by Student's t-test, comparing each KD group to the scrambled control sample. * p < 0.05, ** p < 0.01, *** p < 0.001.
d. We used Deseq2 to identify the transcripts with the highest fold change between the untreated and Pb2+ treated samples. Three biological replicates of each condition were used. Color scale shows a Z-score based on the relative fold-change.
e. SNR vs. the difference in U-to-C error % between untreated and Pb2+ treated samples. Orange dots represent uridine positions that are validated TRUB1 substrates, and blue dots represent uridine positions that are validated PUS7 substrates.
f. Putative psi-positions determined by Mod-p ID are plotted according to the difference in U-to-C basecalling error in the untreated and Pb2+ treated samples against the reads for each position. A dotted line at the +5% and −5% marks indicate the cutoff for a position to be changed in response to perturbation. The inlet shows the sequencing logo for positions within the TRUB1 motif, gray points above the threshold line, and total points above the threshold line.
g. Annotation of genes containing a psi modification that changed in response to perturbation and validated by PUS7 or TRUB1 KD (Figure 2) and orthogonal methods.

