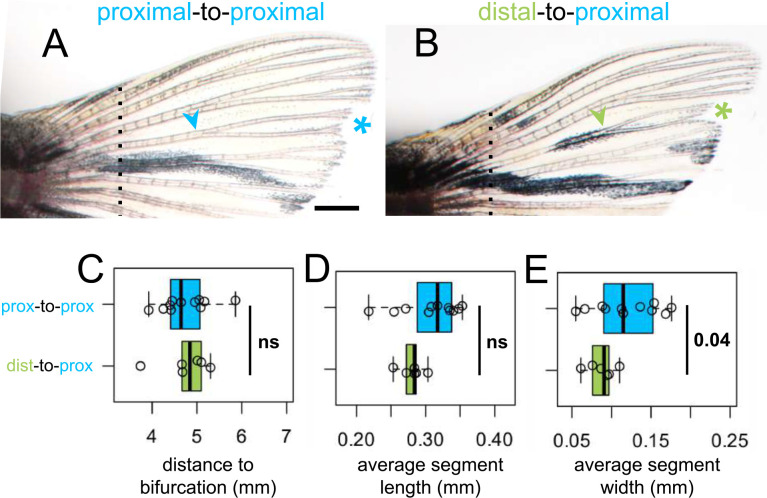
Figure 4. Fin ray patterning matches environment.
Dorsal fin lobe at 35dpa after either (A) proximal-to-proximal (blue asterisk) or (B) distal-to-proximal (green asterisk) transplantation. Amputation plane shown with dashed line. Arrowheads indicate primary bifurcations. Boxplots showing the (C) proximodistal position of the bifurcation, (D) average segment length, and (E) average segment width in regenerate. Significance determined by a Welch two-sample t test. Scale bar, 1 mm.

