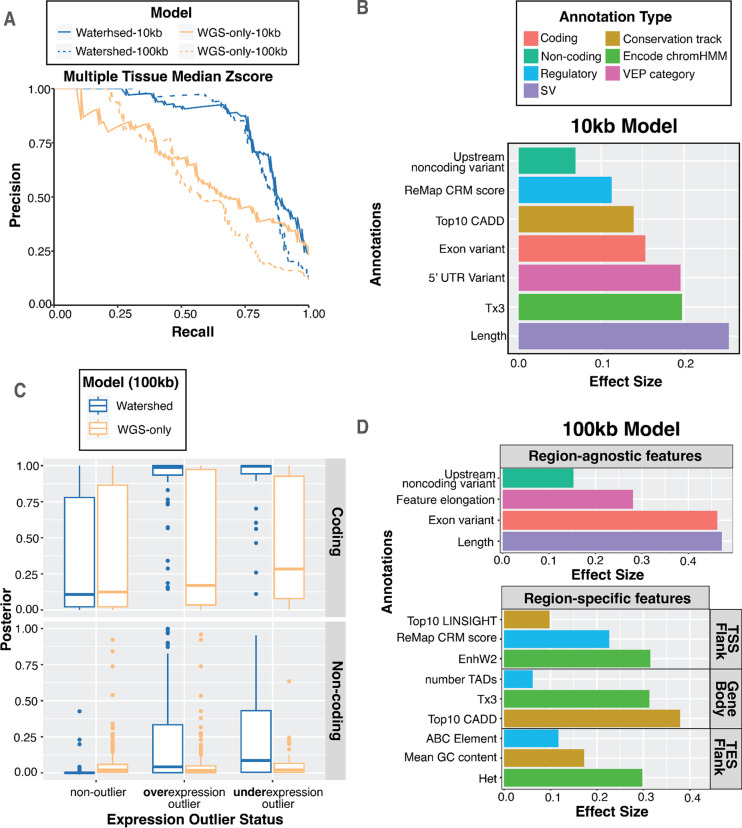
Figure 4. Watershed-SV improves prioritization of rare SVs in healthy and muscular dystrophy cohort.
A Precision-Recall Curves (PRC) of benchmark using held-out N2 pairs; We ran multi-tissue Watershed-SV using both 10kb (solid) and 100kb (dashed) distance limit as well as WGS-only model with the same setup. B top positive genomic annotation effect sizes (β) for 7 major categories of the 10kb multi-tissue Watershed-SV model. C Using a z-score threshold of −3 and 3, we stratified 100kb multi-tissue Watershed-SV model prediction on CMG muscular disorder dataset posterior probabilities by under-, over-, and non-outliers (column), and then by coding vs noncoding variants (row); each dot represent an gene-SV pair. D top positive genomic annotation effect sizes for 100kb multi-tissue Watershed-SV model. 7 annotation categories are grouped into region-specific (TSS/upstream Flank, Gene Body, TES/downstream Flank) and region-agnostic features. Region specific features are separately aggregated for each SV, then collapsed to each gene by regions.

