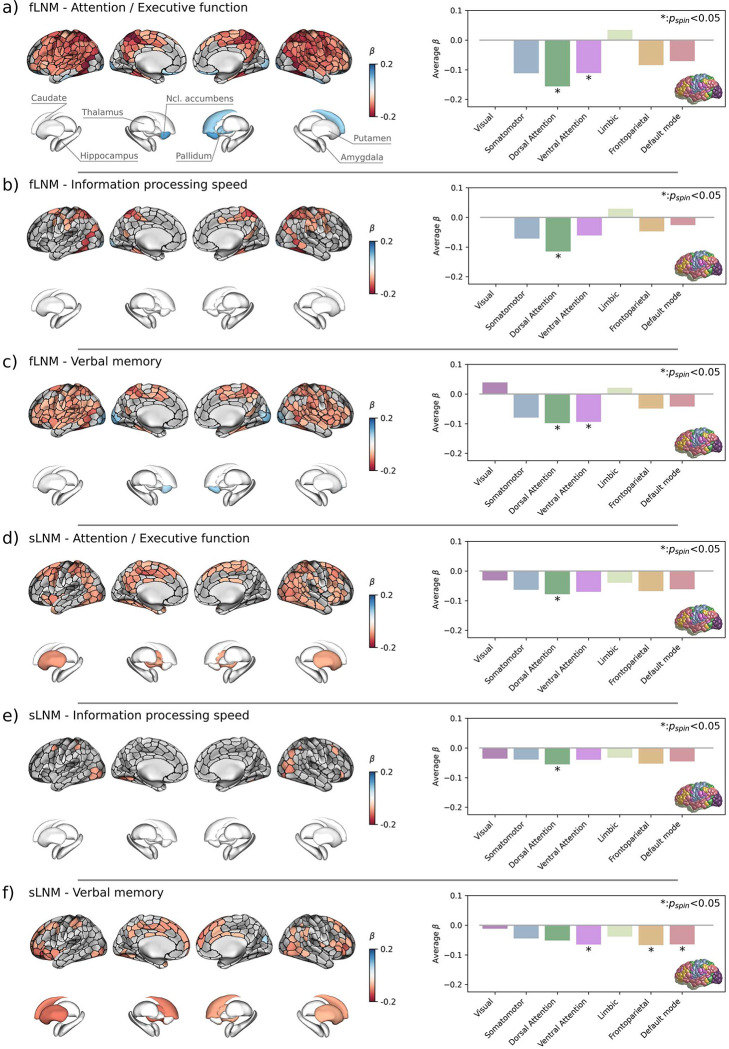
Figure 3. Inferential statistics results of cortical and subcortical gray matter.
Anatomical plots on the left side display the regional relationship between LNM scores and cognitive domain scores. ROIs in which LNM scores across participants were significantly associated with cognitive domain scores after family-wise error-correction are highlighted by colors encoding β-coefficients from general linear models: a negative β (red) denotes that a higher regional LNM score, i.e., higher WMH connectivity, is associated to a lower performance in individual cognitive domains; a positive β (blue) indicates that a higher regional LNM score is linked to a higher cognitive domain performance. Barplots on the right side display the corresponding β coefficients averaged in the canonical (Yeo) resting-state functional connectivity networks. The brain in the lower right corner indicates the regional distribution of the canonical resting-state networks with colors corresponding to the bars. Statistical significance was assessed using spin permutations. Each row corresponds with a different combination of lesion network mapping modality and cognitive domain: a) fLNM – attention / executive function, b) fLNM – information processing speed, c) fLNM – verbal memory, d) sLNM – attention / executive function, e) sLNM – information processing speed, f) sLNM – verbal memory. Abbreviations: fLNM = functional lesion network mapping, pspin = p-value derived from spin permutations, ROIs = regions of interest, sLNM = structural lesion network mapping.

