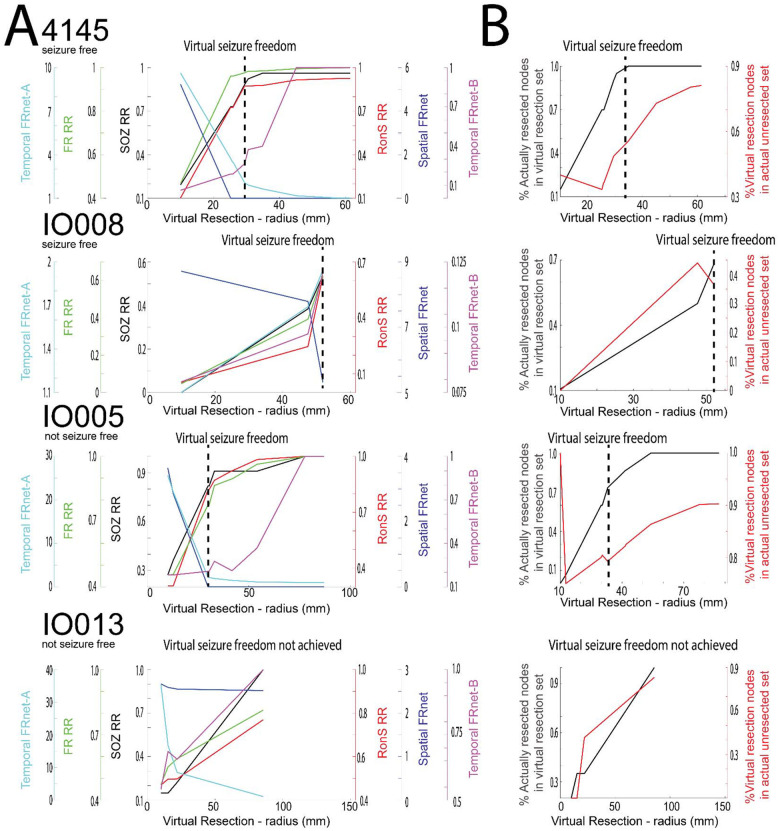
Figure 6: Changes in resection metrics in individual patients at different resection volumes.
A) Comparison of the seizure onset zone resection ratio (SOZ, RR), ripple on spike RR (RonS RR, red), fast ripple RR (FR RR, green), spatial FRnet (blue), temporal FRnet-A (cyan), temporal FRnet-B (magenta) for two seizure free example patients (top), and two non-seizure free example patients (bottom). The hashed vertical line denotes the virtual resection iteration at which virtual seizure freedom is first achieved. Among the four patients, only in IO013 the virtual resection did not produce a seizure free outcome. B) Corresponding plot of the percentage of resected nodes in the resection set (black), and percentage of the virtual resection set in actual unresected nodes (red) for each of the four patients.

