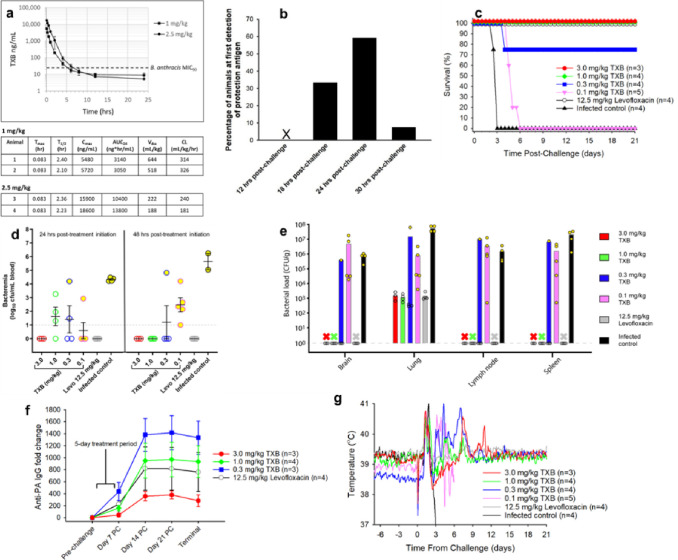
Figure 2. In vivo efficacy.
a, Pharmacokinetic analysis of teixobactin (TXB) in rabbits after a single IV injection of either 1 mg/kg or 2.5 mg/kg. PK Parameters: Tmax = time of maximum teixobactin concentration; T1/2 = time required for plasma concentration of teixobactin to decrease by 50%; Cmax = the highest (peak) teixobactin concentration; AUC24 - area under the serum concentration vs. time curve representing the total teixobactin exposure over 24 hours; Vdss = steady-state volume of distribution representing teixobactin’s propensity to either remain in the plasma or redistribute to other tissue compartments; CL: the clearance rate of teixobactin. b, Appearance of protective antigen (PA) after infection with B. anthracis spores. Rabbits were challenged with 255 × LD50 of B. anthracis spores by inhalation. Beginning 12 hours post-challenge, blood samples were collected every 6 hours to test for the presence of PA based on binding to an anti-PA antibody. c, Efficacy of treating the infection with teixobactin. Antibiotic was administered SID for 5 days by IV once the level of PA became detectable, and survival monitored for 21 days from treatment initiation. d, Blood levels of pathogen. Blood samples were collected at various times after treatment initiation to assess the level of bacteremia. The blood samples were plated on blood agar plates and incubated at 37°C for 16–24 hours. Colonies were enumerated using an automatic colony counter. e, Bacterial load in tissues. Tissue samples were collected at the end of the post-infection monitoring period 21 days after treatment initiation for survivors and 3–6 days post-infection for the non-survivors. 3 out of 4 animals treated with 0.3 mg/kg teixobactin survived infection. No bacterial counts denoted as X (all survivors). Open circles represent survivors and yellow filled circles represent non-survivors (d,e) . f, Increase in the amount of serum anti-PA IgG. g, Core body temperature was recorded every 10 minutes using implanted data loggers. This data was used to calculate 2-hour moving averages for each animal, and the results were averaged among the animals in each group.

