GRAPH 1.

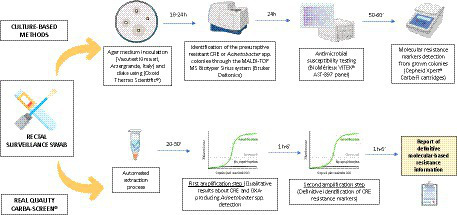
Graphical representation of the applied experimental workflow. Each collected surveillance swab was processed simultaneously through culture-based and molecular methods. The graph was created through the Biorender.com database.

Graphical representation of the applied experimental workflow. Each collected surveillance swab was processed simultaneously through culture-based and molecular methods. The graph was created through the Biorender.com database.