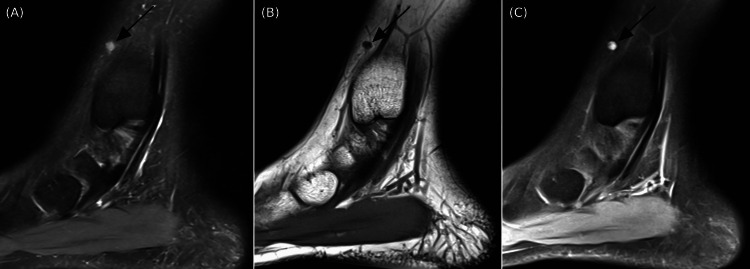
Figure 1. Ankle MRI sagittal images of a small lesion in the subcutaneous fat just below the skin surface at the lateral ankle measuring 3x4x5 mm.
A: Lesion is hyperintense (black arrow); proton density fat saturation MRI sequence. B: Lesion is hypointense (black arrow); T1-weighted MRI sequence. C: Lesion is avidly enhancing (black arrow); T1-weighted fat saturation MRI sequence with gadolinium contrast.

