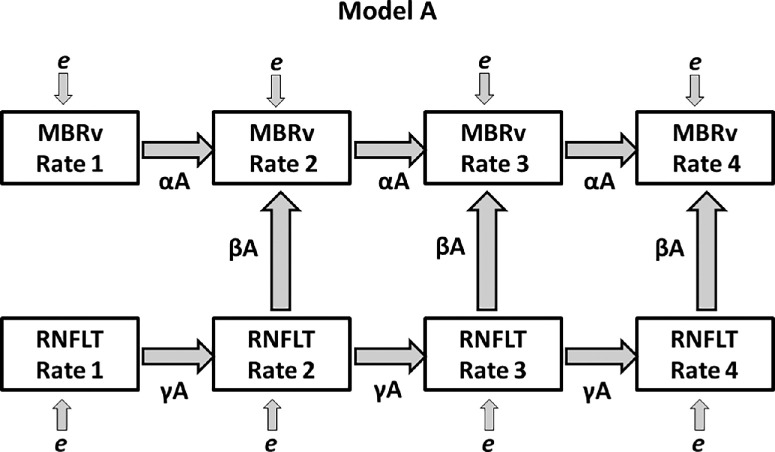
Figure 1.
The path diagram for Model A, one of the four SEMs featured in this study. The observed variables RNFLT Raten and MBRv Raten (average MBR in vessels) are shown, representing the measured rates of change of the two modalities over period n (from visit n − 1 to visit n). Directional arrows indicate regressions, with labeled coefficients. Measurement errors are illustrated as e and are assumed to be Gaussian.

