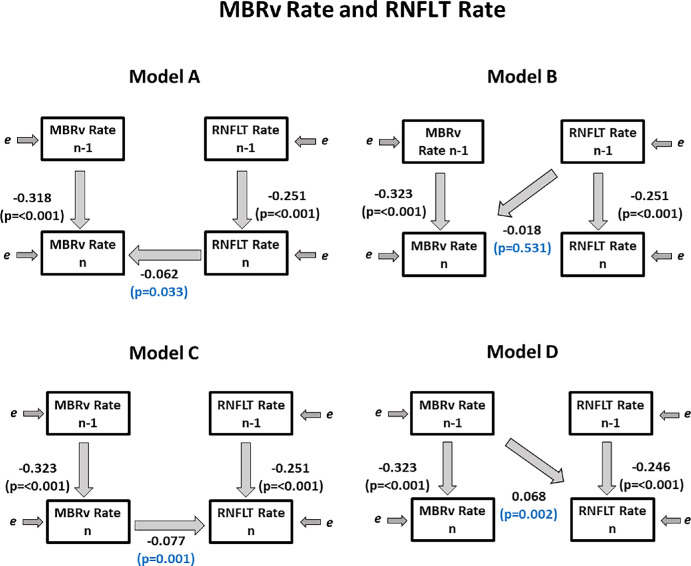
Figure 4.
Fitted coefficients for Models A–D used. Regression coefficients relating the observed variables are shown, showing the relations between the measured rates of change of RNFLT (used as a metric of structural loss) and of MBRv (the blood flow in major vessels within the optic nerve head), over period n − 1 (from visit n − 2 to n − 1) and over period n (from visit n − 1 to visit n).

