

Abstract
Objectives
More than a year has passed since the initial outbreak of SARS-CoV-2, which caused many hospitalizations worldwide due to COVID-19 pneumonia and its complications. However, there is still a lack of information detailing short- and long-term outcomes of previously hospitalized patients. The purpose of this study is to analyze the most frequent lung CT findings in recovered COVID-19 patients at mid-term follow-ups.
Methods
A total of 407 consecutive COVID-19 patients who were admitted to the Fondazione IRCCS Policlinico San Matteo, Pavia and discharged between February 27, 2020, and June 26, 2020 were recruited into this study. Out of these patients, a subset of 108 patients who presented with residual asthenia and dyspnea at discharge, altered spirometric data, positive lung ultrasound and positive chest X-ray was subsequently selected, and was scheduled to undergo a mid-term chest CT study, which was evaluated for specific lung alterations and morphological patterns.
Results
The most frequently observed lung CT alterations, in order of frequency, were ground-glass opacities (81%), linear opacities (74%), bronchiolectases (64.81%), and reticular opacities (63.88%). The most common morphological pattern was the non-specific interstitial pneumonia pattern (63.88%). Features consistent with pulmonary fibrosis were observed in 32 patients (29.62%).
Conclusions
Our work showed that recovered COVID-19 patients who were hospitalized and who exhibited residual symptoms after discharge had a slow radiological recovery with persistent residual lung alterations.
Advances in knowledge
This slow recovery process should be kept in mind when determining the follow-up phases in order to improve the long-term management of patients affected by COVID-19.
Introduction
On March 2020, the World Health Organization (WHO)1 officially declared the rapidly spreading Severe Acute Respiratory Syndrome CoronaVirus-2 (SARS-CoV-2) a global pandemic. To this day, it is still aggressively spreading worldwide, leading to a total of over 170 million confirmed cases and over 3.7 million deaths as of June 8, 2021.
In this context, chest CT imaging plays an important role in COVID-19 diagnosis due to its high sensitivity. Though RT-PCR testing, generally performed on nasal swab samples, is still the recommended tool to detect and confirm SARS-CoV-2 infection,2 CT imaging has proven to be particularly relevant in patients with false-negative RT-PCR test results.3
Due to the large number of COVID-19 patients, many studies have focused their attention mainly on the acute phase of the disease; however, it is also necessary to examine mid- and long-term outcomes, especially considering the described long-term persistence of lung function alterations after the resolution of the acute infection.4 In the course of the last 2 years, we have come to understand that the impact of COVID-19 on the patient’s quality of life often extends further than the treatment of the more severe cases. A new “post-COVID syndrome” is being defined, in which imaging studies have an important role in quantifying residual lung alterations and differentiating between reversible and irreversible injury. Therefore, the importance of clinical and radiological follow-up of these patients is becoming increasingly more evident, and radiologists worldwide have begun to acknowledge this observation.
We decided to focus on reporting lung alterations and prevalent patterns in the first CT follow-up of a select group of patients presenting with residual COVID-19 symptoms, such as dyspnea and asthenia, after discharge.
Methods and materials
Patients
The population of this study consisted of 407 consecutive COVID-19 patients admitted to the Fondazione IRCCS Policlinico San Matteo, Pavia, and discharged between February 27, 2020, and June 26, 2020. 140 of these patients required oxygen therapy and 41 of these patients were admitted to the intensive care unit (ICU).
All patients were evaluated after discharge in a dedicated multidisciplinary outpatient service in the same center. They underwent a full clinical evaluation, spirometry, chest X-ray (CXR), lung ultrasound (LUS), complete blood tests, as well as nasopharyngeal swabs and serological tests for SARS-CoV-2.
A subset of patients at re-evaluation (at a median of 3 months after discharge) who presented with residual asthenia and dyspnea at discharge, altered spirometric data (specifically, carbon monoxide diffusing capacity (DLCO<75%), positive LUS and positive CXR showing residual interstitial or focal abnormalities, was subsequently selected, and scheduled to undergo a mid-term chest CT imaging follow-up. In this way, we avoided exposing the remaining patients who had initially presented as asymptomatic and had shown no pathological alterations on CXR or spirometry, to CT radiation.
Study design
The CT scanners used in this study were a 64-slice system (Somatom Sensation 64, Siemens Healthineers, Erlangen, Germany) and a dual-source 64-slice system (Somatom Definition 64, Siemens Healthineers, Erlangen, Germany).
The selected subset of 108 patients underwent a high-resolution basal inspiratory chest CT scan, with CT acquisition and reconstruction parameters appropriate for an adequate visualization of the lung parenchyma.
An expiratory basal CT scan was also performed in patients in which air-trapping was suspected. Chest CT angiography was added to the basic CT protocol in 81 patients with suspected and recently observed pulmonary embolisms.
Pulmonary embolism was suspected in patients with dyspnea, SpO2<94%, reduced DLCO (<75%) and desaturation at walking test.
CT angiography was performed both in the pulmonary arterial phase as well as in the systemic arterial phase. The arterial phase was added to evaluate the pulmonary arterial structures, as previous cases of pulmonary embolisms as well as chronic disease can also alter the vessel wall structure. The systemic phase was included to evaluate possible systemic vascular anomalies relative to the lung; specifically, bronchial, phrenic and intercostal arteries were evaluated with this phase.
The contrast medium used in this study was Iomeprol 400 mg ml−1 (Iomeron 400, Bracco Imaging, Italy).
Two radiologists with 14 years (AV) and more than 15 years of experience (LP) in thoracic imaging detected and classified the pathological CT alterations. Doubtful findings were reviewed by an additional expert in thoracic radiology (RD) with more than 15 years of experience.
The features evaluated in the lung parenchyma, according to the Fleischner society, “Glossary of Terms for Thoracic Imaging”, were ground-glass opacities (GGOs), consolidations, subpleural bullae, cysts, nodules, tree-in-bud patterns, reticular patterns, honeycombing, bronchiectasis, bronchiolectasis, and linear opacities. The latter finding was classified into linear opacities with a distribution parallel to the pleural surface, those indifferent to the pleura surface, and perilobular linear opacities.
Moreover, other CT lung alterations outside of the above-mentioned classification were also reported, including lung architecture distortions, reductions of lobar volume, pulmonary embolisms, dilation of peripheral lung vessels, bronchomalacia, hilar and mediastinal adenopathies.
CT signs associated with pulmonary hypertension were also reported, such as an enlarged main pulmonary artery, assessed in all patients included in our population both in basal and post-contrast CT scans. In our study, we considered diameters above 29 mm as abnormal.5–7 The right ventricle–to–left ventricle diameter ratio was also measured as an index of right ventricle dilation. Dilation of the bronchial, phrenic, and intercostal arteries were also evaluated in patients who underwent the CT chest angiography; specifically, bronchial arteries with a diameter >1.5 mm8 and non-bronchial arteries with diameter >4 mm8 were classified as pathological.
The presence or absence of each alteration was evaluated in each lung segment. The right lung was divided into 10 anatomical segments: apical, posterior, and anterior segments of the upper lobe, medial and lateral segments of the middle lobe, and superior, anterior, lateral, posterior, and medial basal segments of the lower lobe. The left lung was divided into eight segments: the apical-posterior and anterior segments of the upper lobe, superior and inferior segments of the lingula (considered as a lobe in its own right), and superior, anterior-medial, lateral, and posterior basal segments of the lower lobe. This standard classification of lung segments was used to define the prevalent distribution of the pulmonary alterations.
In addition, the prevalent pattern of lung disease was also reported, and classified into non-specific interstitial pneumonia (NSIP), organizing pneumonia (OP), mixed OP/NSIP, usual interstitial pneumonia (UIP) patterns. Specifically, the presence of bilateral and relatively symmetrical areas of GGO and reticular opacities, with or without traction bronchiectasis, located in the basal segments, with a peripheral and/or diffuse and/or peribronchovascular distribution, with or without subpleural sparing of the lung parenchyma, was classified as an NSIP pattern. The presence of patchy consolidations or nodules with a perilobular distribution, with or without the reverse halo sign, was classified as an OP pattern. The presence of a mix of these features, especially in the case of consolidations superimposed on areas of GGO, were classified as a mixed NSIP/OP pattern.9 The UIP pattern was defined as honeycombing with or without peripheral traction bronchiectasis or bronchiolectasis, with a subpleural and basal prevalence.10
Finally, we have observed and reported fibrotic lung alterations. Specifically, the presence of traction bronchiectasis in the context of GGO areas and/or reticular opacities, bronchiolectasis in the context of reticular opacities, and the presence of honeycombing were classified as fibrotic changes.
We also attempted to clarify the relationship between the presence of specific lung alterations and the severity of respiratory failure in the acute phase of the disease, quantified with the use of high-flow nasal cannula (HFNC), continuous positive airway pressure (CPAP), and invasive mechanical ventilation (endotracheal intubation, ETI) during hospitalization.
Furthermore, the possible correlation between CT signs of pulmonary hypertension (pulmonary artery diameter, pulmonary artery to aorta ratio and RV/LV ratio) and fibrotic lung alteration and age of patients was also evaluated.
Statistical analysis
The observed imaging features were summarized using frequencies and percentages, whereas continuous characteristics were reported as means with standard deviation. Other anomalies were summarized in terms of sums and percentages.
For the correlation with the age of the patients analyses were performed using Stata 17 (StataCorp, College Station, TX). A 2-sided p-value < 0.05 was considered statistically significant. Patients age was summarized with the mean and standard deviation and compared between groups with the Student’s t-test, while its correlation with continuous measures was computed using the Pearson correlation coefficient. 95% confidence intervals (95% CIs) were reported.
Results
A total of 108 out of 407 patients (75 males, 33 females; average age = 62 years; SD = 11.60 years) satisfied the clinical and radiological inclusion criteria to be selected for undergoing the chest CT scan. CT imaging studies were performed between April 21 and October 22, with an average time frame of 88 days after discharge (SD = 48 days).
27 of these patients had been admitted to the ICU (15 males, 12 females), and 26 of these required ETI. Among the 81 patients who had been treated in a general ward, 24 required CPAP and HFNC, 5 required only HFNC and 9 required only CPAP.
Considering the entire study population, 10 patients had a history of known respiratory disease, 4 of them presenting findings suggestive of interstitial lung disease (ILD) and 6 chronic obstructive pulmonary disease (COPD). Seven of them had previous CT examination; three of them did not present new lung parenchymal changes compared to prior exams, thus a score of 0 was assigned; one patient did not show parenchymal alterations at previous CT; the remaining patients had new alterations related with COVID pneumonia.
It was not possible to perform a systematic comparison with previous or baseline CT studies, since CT imaging was not performed at baseline. In Fondazione IRCCS Policlinico San Matteo, Pavia, only chest X-ray studies were systematically performed at baseline in order to reduce the risk of infection, considering the fast spread of the virus during the first wave and the high mortality among patients and healthcare staff. The most frequently observed lung CT alteration were GGO areas, present in 88 out of 108 patients (81%), with an average spatial involvement of 8 involved segments, a highest spatial involvement of 18 segments in 14 patients and a lowest spatial involvement of 0 segments in 1 patient. There was no significant difference in spatial prevalence between lobes nor between segments.
The second most observed lung alteration in order of frequency were linear opacities, which were present in 80 patients (74%). Most of the observed linear opacities were not parallel to the pleural surface. Bronchiolectasis was the third most observed alteration, present in 70 patients (64.81%). Among other observed alterations were reticular opacities (69 patients, 63.88%), followed by lung architecture distortions (41 patients, 37.96%) (Figure 1).
Figure 1.
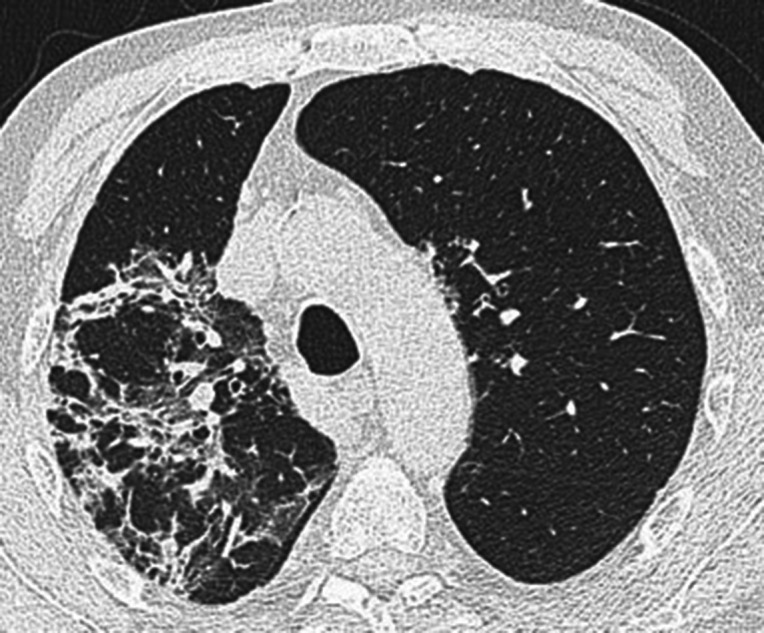
Axial unenhanced chest CT image with lung window setting. Areas of consolidation, GGO as well as linear opacities representing inter- and intralobular septal thickening are observed in the right lung within the context of lung architecture distortion and associated lobar volume reduction. These findings are consistent with an OP pattern. GGO, ground glass opacity; OP, organizing pneumonia.
The latter four alterations were detected in all segments, with a slightly higher prevalence in the lower lobes. No significant difference in spatial prevalence of these alterations was observed between the right and left lung.
Lobar volume reduction was another frequent finding present in almost a third of the patients (29,62%) with a prevalent involvement of the lower lobes.
The diameter of the right ventricle (RV) and of the main pulmonary artery was increased in 8 (7.4%) and 24 patients (22.2%), respectively.
Subpleural bullae were observed in 15 out of 108 patients (13,8%), with a more prevalent involvement of the apical segment of the right upper lobe. Eight of these patients required oxygen therapy. Specifically, four underwent HFNC and CPAP, two underwent CPAP and ETI and two underwent HFNC, CPAP and ETI.
Bronchial arteries were dilated in 17.14% of the population, while the intercostal and phrenic arteries in 7.14% (Figure 2).
Figure 2.
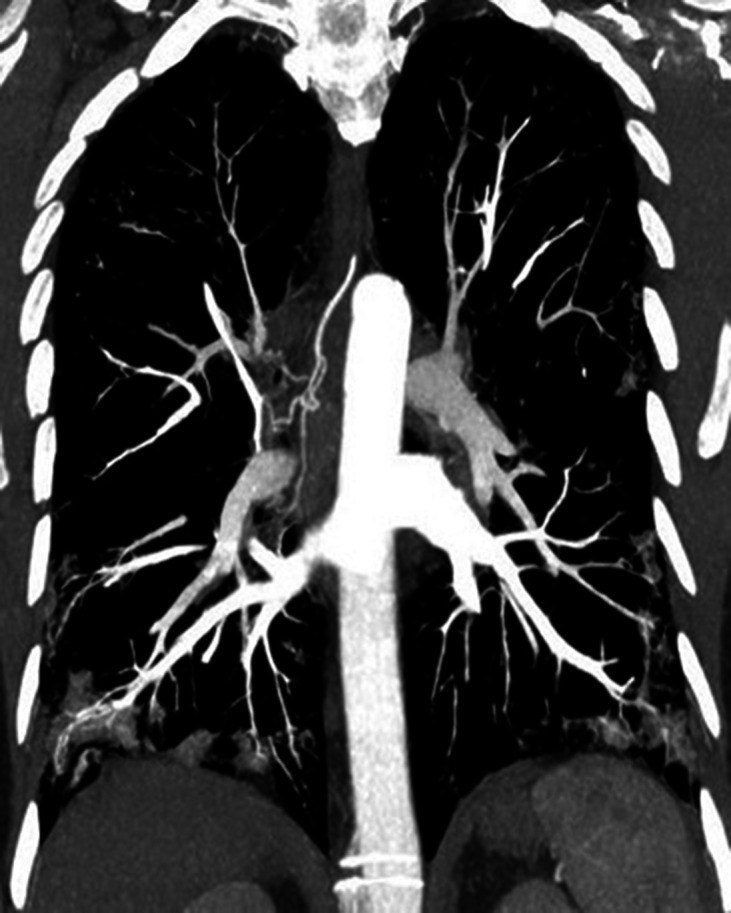
Coronal contrast-enhanced MIP chest CT image with soft tissue window setting in the pulmonary arterial phase. Ectasia of the right bronchial artery can be observed. MIP, maximum intensity projection.
Pulmonary embolism was detected in 4 patients (3.75%) (Figure 3). All four cases were classified as acute pulmonary embolisms, as no adjacent vessel wall alteration indicative of chronic disease was observed in these cases.
Figure 3.

Axial contrast-enhanced MIP chest CT image with soft tissue window setting in pulmonary arterial phase. The presence of a thrombus in an artery supplying the basal segments of the right lobe can be observed. MIP, maximum intensity projection.
Pleural effusion was present in only 9 patients (8.33%).
No signs of bronchomalacia or honeycombing were detected in any patient.
No significant differences between the right and left lung were observed; the overall prevalence of alterations detected was roughly equal in both lungs. NSIP was the most common morphological pattern of this disease, observed in 69 patients (63.88%) without a history of known respiratory disease. Another observed pattern was that of OP, present in only 2 patients (1.85%), whereas we observed a less specific NSIP/OP pattern in 9 patients (8.33%) (Figure 4). The UIP pattern was not observed in any patient in our study population.
Figure 4.

Axial unenhanced chest CT images, with lung window setting, of three different patients. (A) Evident bronchiectasis (arrow) in the context of lung consolidation with CT features consistent with an OP pattern. Due to the possible reversibility of such an alteration, it would not be correct to define this alteration as traction bronchiectasis, especially at such an early time. (B) Diffuse areas of GGO with CT features consistent with a NSIP pattern. Thick peripheral reticular opacities with subpleural sparing and minimal bronchiolar distortion are seen within the same context (arrow). This specific alteration could be consistent with a resolution of a previous consolidation. (C) Diffuse areas of GGO, peripheral consolidation and reticular opacities in a mixed NSIP/OP pattern. A traction bronchiectasis (arrow) is observed in the anterior segment of the upper left lobe in the context of areas of GGO and irregular reticular opacities. These features could be interpreted as probable markers of pulmonary fibrosis. GGO, ground glass opacity; NSIP, non-specific interstitial pneumonia; OP, organizing pneumonia.
Imaging findings consistent with pulmonary fibrosis were observed in 32 patients (29.62%) without a history of known respiratory disease. CT imaging revealed the presence of bronchiectasis within the areas of GGO in 31 cases, with associated reticular opacities in 8 of these cases, whereas 1 patient showed bronchiolectasis associated with reticular opacities. 21 out of these 32 patients (65.62%) required oxygen therapy; 14 were admitted to the ICU, 6 required HFNC and CPAP, and 1 patient required only CPAP. A NSIP pattern was observed in 28 out of these 32 patients (87.5%), an OP pattern was observed in 2 patients, and a NSIP/OP pattern was observed in 2 patients. All imaging findings are summarized in Table 1.
Table 1.
Summary of imaging findings observed in our study population
| Number of patients | Mean of segments involved | Minimum number of segments involved | Maximum number of segments involved | |
|---|---|---|---|---|
| GGO | 88 (81%) | 7,87 | 0 | 18 |
| Bands | 80 (74%) | 3,02 | 0 | 16 |
| Bronchiolectasis | 70 (64.81%) | 3,02 | 0 | 18 |
| Reticular opacities | 69 (63.88%) | 3,37 | 0 | 18 |
| Lung architecture distortion | 41 (37.96%) | 1,61 | 0 | 13 |
| Lobar volume reduction | 32 (29.62%) | 0,49 | 0 | 3 |
| Bronchiectasis | 26 (24.07%) | 0,96 | 0 | 15 |
| Nodule (>3 mm) | 25 (23.14%) | 0,28 | 0 | 3 |
| Consolidation | 22 (20.37%) | 0,39 | 0 | 10 |
| Cyst | 18 (16.66%) | 0,42 | 0 | 12 |
| Subpleural bulla | 15 (13.88%) | 0,21 | 0 | 3 |
| Dilatation of peripheral vessels | 14 (12.96%) | \ | \ | \ |
| Dilatation of right ventricle | 8 (7,4%) | \ | \ | |
| Ectasia of the bronchial arteries | 12 (17.14%) | \ | \ | |
| Pleural effusion | 9 (8.33%) | \ | \ | |
| Interstitial emphysema | 6 (5,5%) | 1,19 | 0 | 8 |
| Ectasia of the intercostal arteries | 5 (7.14%) | \ | \ | |
| Ectasia of the phrenic arteries | 5 (7.14%) | \ | \ | |
| Air trapping | 3 (6.38%) | 0,04 | 0 | 2 |
| Pulmonary embolism | 4 (3,75%) | 0,1 | 0 | 5 |
| Tree-in-bud | 2 (1.85%) | 0,09 | 0 | 7 |
| Honeycombing | 1 (0.92) | 0,03 | 0 | 3 |
| Bronchomalacia | 0 | 0 | 0 |
GGO, ground-glass opacity.
The first column contains a list of all the imaging features that were considered in order of frequency. The second column contains the number of patients in which those features were observed, with the percentage value of the study population in parentheses. The third column contains the maximum number of segments involved that were observed in any single case. As the table indicates, the maximum number of segments involved in any feature is 18, while the minimum number of segments involved is 0.
No correlation was found between the CT signs of pulmonary hypertension, the signs of pulmonary fibrosis and the age of the patients. Statistical results are summarized in Table 1 and Figures 5 and 6.
Figure 5.

Correlation between the age of the patients and the CT signs of pulmonary hypertension: ratio between diameter of the right and the left ventricle (Figure 6A); ratio between diameter of pulmonary artery and aortic diameter (Figure 6B); pulmonary artery diameter (Figure 6C).
Figure 6.

Correlation between the CT signs of pulmonary fibrosis and the age of the patients.
Discussion
Our study shows a very high rate (97,2%) of relevant lung CT alterations in the mid-term follow-up of previously hospitalized COVID-19 patients with residual symptoms after discharge.
We believe that the selection of a symptomatic population strongly contributed to these results. However, this selection not only had the aforementioned advantage of selectively exposing patients to CT radiation, but also of adequately prioritizing follow-up care within the study population. This stepwise diagnostic approach led to the identification of 26% of the initial cohort of patients needing further evaluation with imaging studies.
Other studies reviewed the typical lung CT alterations in patients with COVID-19 pneumonia,11 and some of these also differentiated between the short- and long-term outcomes in discharged patients. As an example of a short-term follow-up study, Zhong et al described the main pulmonary findings in patients with moderate and severe COVID-19 pneumonia 11 days after discharge and observed that GGO areas were present in 91.67% of the patients with residual alterations.12 GGO areas were also observed to be the most prevalent disease finding at the first follow-up in another similar study with a cohort of 51 patients.13 This imaging presentation is relatively similar to the one observed during the early stages of the disease, which is in line with previous studies in literature.14
Martini et al have also found the same major changes in CT imaging follow-up at 3 months; specifically, GGO remain the most frequent CT findings observed in up to two-third or more of patients, followed by linear consolidation or band-like and perilobular opacities.15
Similar imaging findings have also been detected at long-term follow-ups, as described by Chaolin Huang et al.16
Furthermore, in the review by Diana Sanchez Ramirez based on 24 previous articles on the long-term impact of COVID-19 between 3 and 6 months after symptom onset or hospital discharge, GGO was the most frequent alteration, followed by interstitial thickening, parenchymal bands and bronchiectasis.17
Likewise, most patients in our own study exhibited GGO areas as the most common imaging finding (81%), followed by linear opacities (74%), in the mid-term follow-up. This finding suggests that a considerable percentage of patients exhibit residual CT lung alterations, which is in line with the data from the study conducted by van den Borst et al.18
Only 4 out of 108 patients (2.8%) in our study showed negative CT scans, whereas complete resolution of lung findings was reported in 57.7% of patients in a similar study conducted by Seyed et al. The latter study enrolled patients with persistent symptoms and functional impairment at mid-term chest CT follow-up, describing only the most prevalent pulmonary lesions, such as GGO areas with or without intralobular lines, consolidations, mixed consolidations and GGO areas with linear opacities.19
In contrast, our study also reported some less frequent features that, nonetheless, we believe still hold clinical significance. A specific example of these less frequent features is the dilation of the main pulmonary artery. In the case of our population, we believe that in some cases it may have been caused by a traction effect by the “stiff lung” conditioned by interstitial pneumonia, rather than by a possible development of pulmonary hypertension. Though we were unaware of whether these patients suffered from pulmonary hypertension in the past, we nonetheless believe this finding to be clinically relevant in the context of recovered COVID-19 patients. Several studies have shown that main pulmonary artery dilation is associated with worse outcomes independently of the presence of pulmonary hypertension.20–22
Most of the studies in recent literature describe an improvement of lung alterations from the acute phase to the follow-up, with residual alterations being more often associated with events such as a history of severe COVID-19 pneumonia, higher body mass index, longer hospital stays, or higher rate of ICU admission.23 However, we are unable to draw this comparison, as CT studies in our study were not routinely performed during hospitalization; on the contrary, CXR studies were the main imaging modality used for monitoring patients during their hospitalization.
Some recent studies have discussed the possibility of pulmonary fibrotic evolution in recovered COVID-19 patients. We believe, however, that the risk of overestimating fibrotic changes should not be neglected.
For instance, Zhen Lu Yang et al considered linear opacities, irregular interfaces, traction of bronchiectasis, lung distortion and honeycombing as fibrotic changes; these were present in 46% of their population.24 On the contrary, we reported fibrotic changes in a lower percentage of patients (29.62%), while also describing morphological patterns of interstitial lung disease, with NSIP being the most commonly observed morphological pattern in our study. The difference in these results could be ascribed to the use of different sets of fibrotic features analyzed in these two studies, as there are no standardized criteria of fibrotic changes associated with COVID-19. For example, we did not consider linear opacities as exclusively consistent with fibrosis, since these could also be indicative of organizing pneumonia, especially at early stages of follow-up. Furthermore, most of the observed linear opacities that were parallel to the pleural surface were consistent with linear atelectasis, which justifies the loss of lobar volume that was observed in nearly a third of patients.
We also attempted to clarify the relationship between severe pulmonary CT alterations and ICU admission or high-flow oxygen therapy. We observed that 65.62% of our patients with residual fibrotic changes on chest CT required oxygen therapy, and more than half of our patients were admitted to the ICU. This finding could be ascribed to an increased severity of the cases of pneumonia that required intubation, and is in line with the study conducted by Gonzales et al, which revealed similar findings in patients that required ICU admission and that were evaluated 3 months after hospitalization discharge.25 Interestingly, in another similar study by Zhen Lu Yang et al, fibrotic changes were seen to be more prevalent in patients subjected to non-invasive mechanical ventilation treatment.24 Furthermore, some studies describe pathophysiological mechanisms of COVID-19 that may cause decreased lung compliance or the aforementioned “stiff lung”, which may in turn result in the formation of subpleural bullae after mechanical ventilation damage.
Therefore, we are unable to determine what proportion of the apparent fibrotic alterations were caused by mechanical ventilation26 or lung inflammation; and thus, we are unable to specify whether these changes are truly indicative irreversible pulmonary fibrosis, given the short time elapsed between the acute phase of the disease and the CT scan.
The definition “fibrotic lung alterations” should be used cautiously, as various authors prefer to use the term “fibrotic-like changes” such as Han and Fan et al, who documented fibrotic-like abnormalities at 6-month follow-up CT study in a large proportion of patients with severe COVID-19.
In this regard, Wells in his review on interstitial lung disease after COVID-19 infection, argues that it is more accurate to speak of “fibrotic-like” appearances, given that the term fibrosis refers to an irreversible disease.
Thus, the use of the term post-COVID ILD would assume that those residual abnormalities following the acute episode have a slow regression.
Furthermore, he stresses that apparent fibrosis at CT is not synonymous with true fibrosis, which is defined histologically.27
The main limitation of our study was the relatively short time between patient discharge and the CT follow-up. A longer term follow-up would be very important to determine the significance of these “fibrotic-like” alterations. So further studies are needed to evaluate whether, and how often, a complete resolution of residual fibrotic findings is observed.
Moreover, several clinical trials are ongoing to establish efficacy and safety of some drugs. However, it is currently unknown if antifibrotic drugs approved for treatment of idiopathic pulmonary fibrosis, systemic sclerosis-associated ILD and ILDs with a progressive phenotype, can also have a role for post Covid fibrotic ILD.28
On the other hand, the treatment of pulmonary embolism is well established and consists of anticoagulant drugs. However, if unrecognized,it can lead to a rare but fearsome complication, Chronic thromboembolic pulmonary hypertension. Considered the high number of patients affected by COVID 19 and the public concern, it is crucial to identify patients undergoing long-term sequelae, performing a thoracic CT in presence of symptoms or signs suggestive for TEP or if a fibrotic evolution is suspected.
In conclusion, we can affirm that recovered COVID-19 patients that were hospitalized and that exhibited residual symptoms after discharge had a slow radiological recovery with persistent residual lung alterations. Overall, we have observed that the severity of these alterations roughly correlated with the severity of the disease, confirming the data in the literature.29 We believe that this slow recovery process should be kept in mind when determining the follow-up phases in order to improve the long-term management of patients affected by COVID-19.
Footnotes
Funding: The authors state that this work has not received any funding.
Compliance with ethical standards: Guarantor: The scientific guarantor of this publication is Prof Lorenzo Preda.
Conflicts of interest: The authors have nothing to disclose.
Statistics and biometry: One of the authors has significant statistical expertise.
Informed consent: Written informed consent was obtained from all subjects (patients) in this study.
Ethical approval: Institutional review board approval was obtained.
Contributor Information
Francesca Marchetti, Email: francescamarchetti700@gmail.com, Department of Clinical, Surgical, Diagnostic and Pediatric Sciences, University of Pavia, Pavia, Italy..
Nicoletta Izzi, Email: nicolettaizzi92@gmail.com, Department of Clinical, Surgical, Diagnostic and Pediatric Sciences, University of Pavia, Pavia, Italy..
Antonella Donatelli, Email: antonella.donatelli@libero.it, Department of Clinical, Surgical, Diagnostic and Pediatric Sciences, University of Pavia, Pavia, Italy..
Adele Valentini, Email: a.valentini@smatteo.pv.it, Radiology Institute, Fondazione IRCCS Policlinico San Matteo, Pavia, Italy.
Shaun Ivan Muzic, Email: shaunivan.muzic@gmail.com, Department of Clinical, Surgical, Diagnostic and Pediatric Sciences, University of Pavia, Pavia, Italy..
Roberto Dore, Email: robydore1951@libero.it, Radiology Unit, Cinical Institute Città di Pavia, Pavia, Italy.
Antonio Di Sabatino, Email: a.disabatino@smatteo.pv.it, Department of Internal Medicine, Fondazione I.R.C.C.S. Policlinico San Matteo, University of Pavia, Pavia, Italy.
Tiziano Perrone, Email: T.Perrone@smatteo.pv.it, Department of Internal Medicine, Fondazione I.R.C.C.S. Policlinico San Matteo, University of Pavia, Pavia, Italy.
Francesco Falaschi, Email: F.Falaschi@smatteo.pv.it, Internal Medicine 2, Fondazione IRCCS Policlinico San Matteo, University of Pavia, Pavia, Italy.
Umberto Sabatini, Email: umberto.sabatini01@universitadipavia.it, Department of Internal Medicine, Fondazione I.R.C.C.S. Policlinico San Matteo, University of Pavia, Pavia, Italy.
Alessia Ballesio, Email: alessia.ballesio01@universitadipavia.it, Department of Internal Medicine, Fondazione I.R.C.C.S. Policlinico San Matteo, University of Pavia, Pavia, Italy.
Federica Meloni, Email: f.meloni@smatteo.pv.it, University of Pavia and Pneumology Unit, Fondazione IRCCS Policlinico San Matteo, Pavia, Italy.
Sara Lettieri, Email: sara.lettieri01@universitadipavia.it, Department of Anesthesia, Intensive Care and Pain Therapy, Fondazione IRCCS Policlinico San Matteo, Pavia, Italy.
Francesco Mojoli, Email: f.mojoli@smatteo.pv.it, Department of Clinical, Surgical, Diagnostic and Pediatric Sciences, University of Pavia, Pavia, Italy..
Stefano Perlini, Email: s.perlini@smatteo.pv.it, Department of Internal Medicine, Fondazione I.R.C.C.S. Policlinico San Matteo, University of Pavia, Pavia, Italy.
Stefano Novati, Email: s.novati@smatteo.pv.it, Department of Infectious Diseases, Fondazione IRCCS Policlinico San Matteo, University of Pavia, Pavia, Italy.
Elisabetta Pagani, Email: e.pagani@smatteo.pv.it, Department of Infectious Diseases, Fondazione IRCCS Policlinico San Matteo, University of Pavia, Pavia, Italy.
Catherine Klersy, Email: c.klercy@smatteo.pv.it, Clinic Epidemiology and Biometry Unit, Fondazione IRCCS Policlinico San Matteo, Pavia, Italy.
Raffaele Bruno, Email: r.bruno@smatteo.pv.it, Department of Clinical, Surgical, Diagnostic and Pediatric Sciences, University of Pavia, Pavia, Italy..
Lorenzo Preda, Email: lorenzo.preda@unipv.it, Department of Clinical, Surgical, Diagnostic and Pediatric Sciences, University of Pavia, Pavia, Italy..
REFERENCES
- 1. WHO Director-General’s opening remarks at the media briefing on COVID-19. Geneva: World Health Organization; 2020, p.254. [Google Scholar]
- 2. World Health Organization. Coronavirus disease (COVID-19) technical guidance: laboratory testing for 2019-nCoV in humans. Geneva: World Health Organization; 2020. [Google Scholar]
- 3. Mathias Prokop MD, Wouter van Everdingen MD. “COVID-19 standardized reporting” working group of the dutch radiological society. CO-RADS – A categorical CT assessment scheme for patients with suspected COVID-19: definition and evaluation. Radiology 2020. doi: 10.1148/radiol.2020201473 [DOI] [PMC free article] [PubMed] [Google Scholar]
- 4. Bellan M, Soddu D, Balbo PE, Baricich A, Zeppegno P, Avanzi GC, et al. Respiratory and psychophysical sequelae among patients with COVID-19 four months after hospital discharge. JAMA Netw Open 2021; 4: e2036142. doi: 10.1001/jamanetworkopen.2020.36142 [DOI] [PMC free article] [PubMed] [Google Scholar]
- 5. Frazier AA, Galvin JR, Franks TJ, Rosado-De-Christenson ML. From the archives of the AFIP: pulmonary vasculature: hypertension and infarction. Radiographics 2000; 20: 491–524. doi: 10.1148/radiographics.20.2.g00mc17491 [DOI] [PubMed] [Google Scholar]
- 6. Hansell DM. Small-Vessel diseases of the lung: CT-pathologic correlates. Radiology 2002; 225: 639–53. doi: 10.1148/radiol.2253011490 [DOI] [PubMed] [Google Scholar]
- 7. Tan RT, Kuzo R, Goodman LR, Siegel R, Haasler GB, Presberg KW. Utility of CT scan evaluation for predicting pulmonary hypertension in patients with parenchymal lung disease. medical College of Wisconsin lung transplant group. Chest 1998; 113: 1250–56. doi: 10.1378/chest.113.5.1250 [DOI] [PubMed] [Google Scholar]
- 8. Remy-Jardin M, Duhamel A, Deken V, Bouaziz N, Dumont P, Remy J. Systemic collateral supply in patients with chronic thromboembolic and primary pulmonary hypertension: assessment with multi-detector row helical CT angiography. Radiology 2005; 235: 274–81. doi: 10.1148/radiol.2351040335 [DOI] [PubMed] [Google Scholar]
- 9. Sverzellati N, Lynch DA, Hansell DM, Johkoh T, King TE, Travis WD. American thoracic society-european respiratory Society classification of the idiopathic interstitial pneumonias: advances in knowledge since 2002. Radiographics 2015; 35: 1849–71. doi: 10.1148/rg.2015140334 [DOI] [PubMed] [Google Scholar]
- 10. Raghu G, Remy-Jardin M, Myers JL, Richeldi L, Ryerson CJ, Lederer DJ, et al. Diagnosis of idiopathic pulmonary fibrosis. An official ats/ers/jrs/alat clinical practice guideline. Am J Respir Crit Care Med 2018; 198: e44–68. doi: 10.1164/rccm.201807-1255ST [DOI] [PubMed] [Google Scholar]
- 11. Heshui Shi MD, Xiaoyu Han MD, Nanchuan Jiang MD, Yukun Cao MD, OsamahAlwalid, MD, JinGu MD, et al. Radiological findings from 81 patients with COVID-19 pneumonia in wuhan, china: a descriptive study. Lancet Infect Dis 2020; 20: 425–34. doi: 10.1016/S1473-3099(20)30086-4 [DOI] [PMC free article] [PubMed] [Google Scholar]
- 12. Zhong L, Zhang S, Wang J, Zhao X, Wang K, Ding W, et al. Analysis of chest CT results of coronavirus disease 2019 (COVID-19) patients at first follow-up. Canadian Respiratory Journal 2020; 2020: 5328267. doi: 10.1155/2020/5328267 [DOI] [PMC free article] [PubMed] [Google Scholar]
- 13. Liu C, Ye L, Xia R, Zheng X, Yuan C, Wang Z, et al. Chest computed tomography and clinical follow-up of discharged patients with COVID-19 in wenzhou city, zhejiang, china. Ann Am Thorac Soc 2020; 17: 1231–37. doi: 10.1513/AnnalsATS.202004-324OC [DOI] [PMC free article] [PubMed] [Google Scholar]
- 14. Carotti M, Salaffi F, Sarzi-Puttini P, Agostini A, Borgheresi A, Minorati D, et al. Chest CT features of coronavirus disease 2019 (COVID-19) pneumonia: key points for radiologists. Radiol Med 2020; 125: 636–46. doi: 10.1007/s11547-020-01237-4 [DOI] [PMC free article] [PubMed] [Google Scholar]
- 15. Martini K, Larici AR, Revel MP, Ghaye B, Sverzellati N, Parkar AP, et al. COVID-19 pneumonia imaging follow-up: when and how? A proposition from ESTI and ESR. Eur Radiol 2022; 32: 2639–49. doi: 10.1007/s00330-021-08317-7 [DOI] [PMC free article] [PubMed] [Google Scholar]
- 16. Huang C, Huang L, Wang Y, Li X, Ren L, Gu X, et al. 6-Month consequences of covid-19 in patients discharged from Hospital: a cohort study. The Lancet 2021; 397: 220–32. doi: 10.1016/S0140-6736(20)32656-8 [DOI] [PMC free article] [PubMed] [Google Scholar]
- 17. Sanchez-Ramirez DC, Normand K, Zhaoyun Y, Torres-Castro R. Long-Term impact of COVID-19: a systematic review of the literature and meta-analysis. Biomedicines 2021; 9(8): 900. doi: 10.3390/biomedicines9080900 [DOI] [PMC free article] [PubMed] [Google Scholar]
- 18. Borst, MD, PhD JBP, PhD MB, MD P, Yvonne Schoon MD, et al. n.d.).( . Mathias Prokop, MD, PhD, Jan Vercoulen, PhD, Michel van den Heuvel, MD, PhD. Comprehensive health assessment three months after recovery from acute COVID-19. Clinical Infectious Diseases 306 2020 [Google Scholar]
- 19. Tabatabaei SMH, Rajebi H, Moghaddas F, Ghasemiadl M, Talari H. Chest CT in COVID-19 pneumonia: what are the findings in mid-term follow-up? Emerg Radiol 2020; 27: 711–19. doi: 10.1007/s10140-020-01869-z [DOI] [PMC free article] [PubMed] [Google Scholar]
- 20. Kammerlander AA, Aschauer S, Zotter-Tufaro C, Duca F, Knechtelsdorfer K, Wiesinger M, et al. Diameter of the pulmonary artery in relation to the ascending aorta: association with cardiovascular outcome. Radiology 2017; 284: 685–93. doi: 10.1148/radiol.2017161849 [DOI] [PubMed] [Google Scholar]
- 21. Shin S, King CS, Puri N, Shlobin OA, Brown AW, Ahmad S, et al. Pulmonary artery size as a predictor of outcomes in idiopathic pulmonary fibrosis. Eur Respir J 2016; 47: 1445–51. doi: 10.1183/13993003.01532-2015 [DOI] [PubMed] [Google Scholar]
- 22. Wells JM, Washko GR, Han MK, Abbas N, Nath H, Mamary AJ, et al. Pulmonary arterial enlargement and acute exacerbations of COPD. N Engl J Med 2012; 367: 913–21. doi: 10.1056/NEJMoa1203830 [DOI] [PMC free article] [PubMed] [Google Scholar]
- 23. Parry AH, Wani AH, Shah NN, Jehangir M. Medium-term chest computed tomography (CT) follow-up of COVID-19 pneumonia patients after recovery to assess the rate of resolution and determine the potential predictors of persistent lung changes. Egypt J Radiol Nucl Med 2021; 52(1. doi: 10.1186/s43055-021-00434-z [DOI] [Google Scholar]
- 24. Yang ZL, Chen C, Huang L, Zhou SC, Hu YN, Xia LM, et al. Fibrotic changes depicted by thin-section CT in patients with COVID-19 at the early recovery stage: preliminary experience. Front Med (Lausanne) 2020; 7: 605088. doi: 10.3389/fmed.2020.605088 [DOI] [PMC free article] [PubMed] [Google Scholar]
- 25. González J, Benítez ID, Carmona P, Santisteve S, Monge A, Moncusí-Moix A, et al. Pulmonary function and radiologic features in survivors of critical COVID-19: A 3-month prospective cohort. Chest 2021; 160: 187–98. doi: 10.1016/j.chest.2021.02.062 [DOI] [PMC free article] [PubMed] [Google Scholar]
- 26. Gattinoni L, Chiumello D, Caironi P, Busana M, Romitti F, Brazzi L, et al. COVID-19 pneumonia: different respiratory treatments for different phenotypes? Intensive Care Med 2020; 46: 1099–1102. doi: 10.1007/s00134-020-06033-2 [DOI] [PMC free article] [PubMed] [Google Scholar]
- 27. Wells AU, Devaraj A, Desai SR. Interstitial lung disease after COVID-19 infection: a catalog of uncertainties. Radiology 2021; 299: E216–18. doi: 10.1148/radiol.2021204482 [DOI] [PMC free article] [PubMed] [Google Scholar]
- 28. Dhooria S. Postgraduate Institute of Medical Education and Research. Pirfenidone vs. Nintedanib for Fibrotic Lung Disease After Coronavirus Disease-19 Pneumonia (PINCER). National Library of Medicine; 2021. [Google Scholar]
- 29. Xiong Y, Sun D, Liu Y, Fan Y, Zhao L, Li X, et al. Clinical and high-resolution CT features of the COVID-19 infection: comparison of the initial and follow-up changes. Invest Radiol 2020; 55: 332–39. doi: 10.1097/RLI.0000000000000674 [DOI] [PMC free article] [PubMed] [Google Scholar]