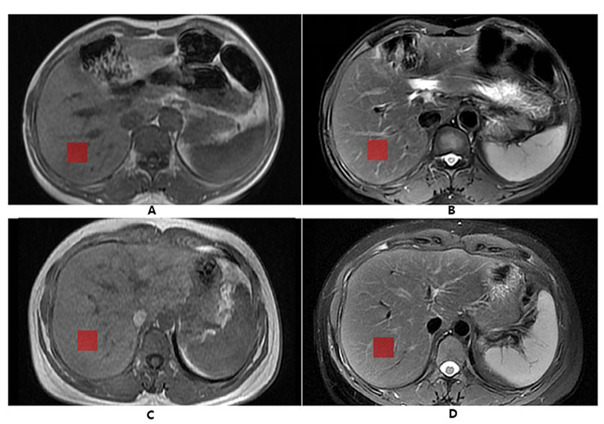
Figure 2.
ROI delineation diagram of MR images. The above two pictures (A, B) show the normal MR images of a 44-year-old female. (A) T IW sequence; (B) T 2WFS sequence; The two images below (C, D) show a 45-year-old male patient with chronic viral hepatitis B with fibrosis Stage 2 and inflammatory activity Grade 2; (C) T IW sequence; (D) T 2WFS sequence; The red squares are the ROI. ROI, region of interest.

