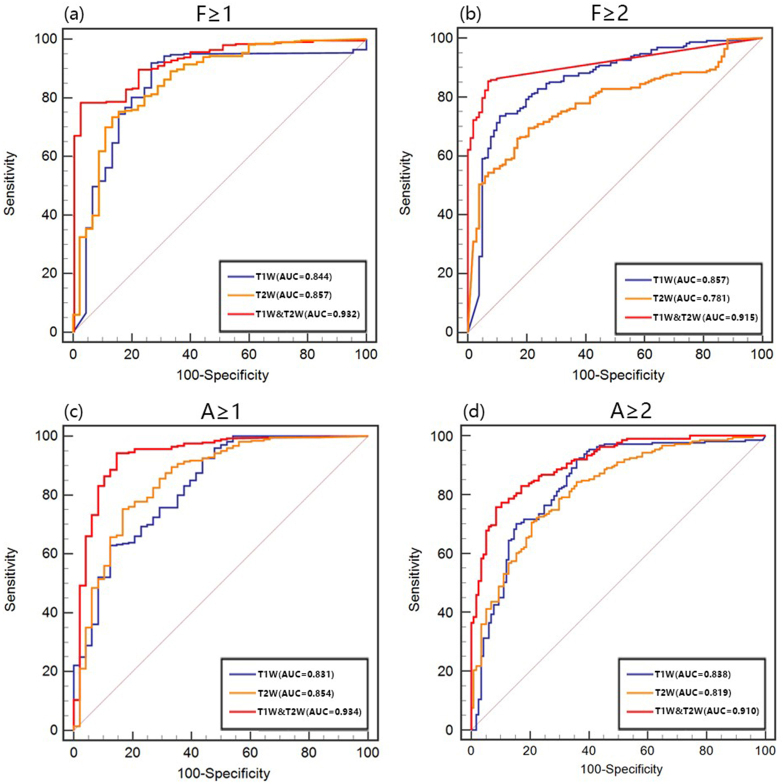
Figure 3.
ROC curves of the models for predicting the stage of liver fibrosis and the grade of inflammatory activity
(a), (b) ROC curves for models built based on radiomics features of T 1W, T 2WFS, and T 1W&T 2WFS images for discriminating fibrosis stage F ≥ 1 and F ≥ 2; (c), (d) ROC curves for models built based on radiomics features of T 1W, T 2WFS, and T 1W&T 2WFS images for discriminating inflammatory activity grade A ≥ 1 and A ≥ 2. ROC, receiver operating characteristic.

